Hi, everybody. Dave Burnett here from AOKMarketing just wanted to spend a few minutes today to go over some things in Google analytics to answer some questions that we often get.
I figured it’d be easier just to put a quick video together so you can take a look at it in your own time, and hopefully, it’ll be helpful to you.
So today, looking at Google analytics, I am just going to cover the real-time overview.
If you look on the left side of Google Analytics, once you’re logged in and… backing up a quick sec, this is a demo store. So this is something that you, as somebody who’s watching, this could go on I’ve access to as well. What this is a Google has set up a demo store for their swag merchandise store. So t-shirts, pens, hats, all that kind of good stuff. And they’ve set this up so that you can access it and play around with Google analytics.
So this is the universal analytics view. And if you go to Google and type in Google demo analytics account, it will show you a link to this. And then you can add it into your analytics accounts, which is what’s kind of cool.
Now that we’ve covered the basics there with what we’re looking at, you can see here on this particular interface that we’ve got how many viewers are active right now, and then it’s got desktop and mobile. And if there were any tablet viewers, they would also show tablets cross here is the page views per minute. And it was a number of pages there. And then this is the page views per second, which is very interesting.
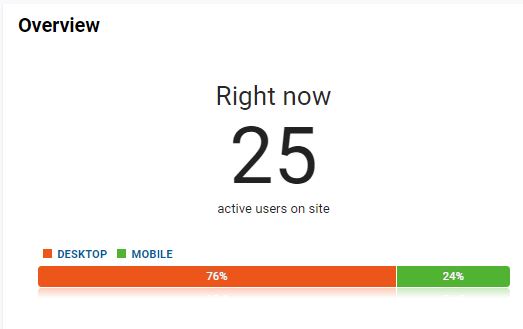
People often ask, okay, with a real-time overview. Cool. I get it. But why who cares?
So the reason why we use it is if you’ve got a press release going out, if you’ve got a big launch, that’s going out. If you’re “everybody sign up by 9:00 AM”, kind of a thing going on, and this is where the real-time overview can come in, very handy. See people using it, see if anybody’s getting stuck in their customer journey. And you know, just kind of use other tools to do that as well. But you can see in Google Analytics, where they get stuck.
Right here, top active pages. And I don’t know if you’ve noticed, but that kind of switches based on who is on the site; these are referral sources.
Other websites that have LinkedIn most, because this is the Google merchandise store. Most of it, most of their traffic comes from internal use. You can see it glow it over here, again, top social traffic and top keywords. Again, it’s mostly internal use direct use people type in internally yet to access the store.
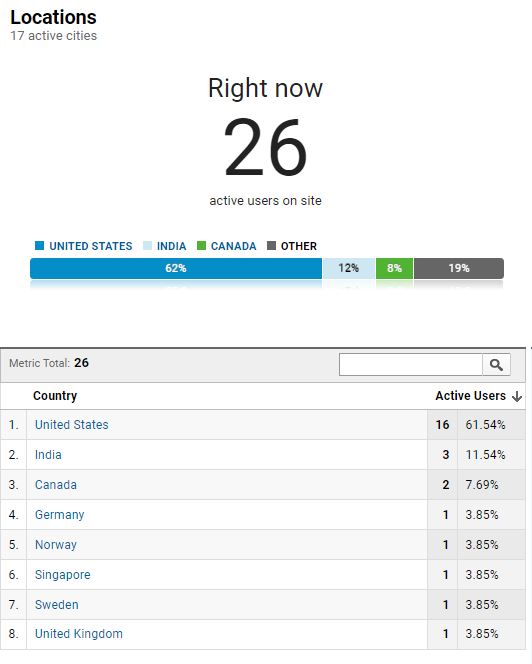
Here are the different locations. You know, you’ve got some us, you’ve got some from India, some Milan, some, a bunch of different places.
If you want to know exactly where they are coming from and what they’re doing, oh, there’s a little tablet, traffic. One person who has signed up with nerves is surfing the site on their tablet.
Take a look, the UK locations here are the active locations, 40%, 44% of users on the US, 12% from India, 6% from Canada and Spain and Taiwan, and then others. You can see these changes in a live stream as well. So that’s location. So if you sent out something and you were expecting traffic from a particular location, this is how you can verify that traffic sources.
Interestingly, they have three different traffic sources for current traffic in the last 30 minutes. That’s the other thing I should’ve mentioned; this only covers the last 30 minutes. So real-time is the last 30 minutes. So we’ve got none that has people have typed in the direct URL. People, actually a CPC. So they pay for ads and CPCs, you know, as cost per click; they pay for ads to drive people to this store. And then they’ve also got a video.
So that’s interesting when you look at the content; these are the pages that people are visiting. These are the active pages down the left here. This is the page title that they’ve got labelled. Here you see the home screen, which is usually the most popular page, Google online store, and then women’s apparel merchandise store, which is very interesting. And when you get down here, there’s some actual products, the Google cloud polo; the Google, Heather Green speckled T there’s several different things. And then actually seeing here on the shopping cart as well. So there are some different things that you can see.
Here, you can get the page views. So, you know, this particular page, Google redesign shop by brand YouTube quick view, has 444 page views. So that might be something that they most recently launched. And I’m not even going to try and pronounce this, but it’s very, very interesting that this is a particularly popular page. So maybe, they launched something overseas.
And if you look back at the locations again, perhaps it was something in Taiwan, who knows. So when we look back over here again to the page views, they’ve got, oh, interestingly, now that we’ve gone to the pages, they’ve got a bunch of other things. So they’ve got the email test newsletter test and affiliate and a video. So maybe they’re getting ready to send out a newsletter.
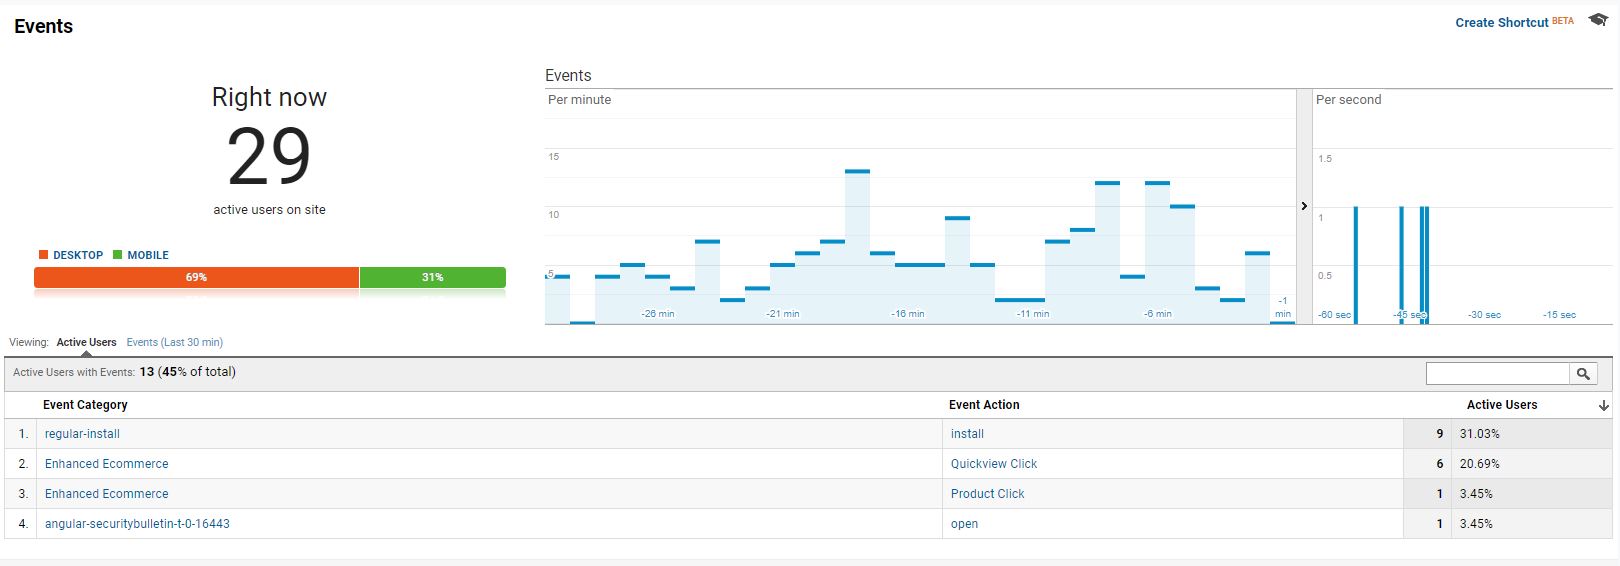
When we look over here at the content, we talked about the page views when we look at the events, so what they can do is they can track events within Google analytics as well.
This is very helpful in terms of trying to understand where people fall out of the funnel, you know, it, which sounds terrible, but it’s people who are in the process of buying and then decide, I got to add to cart, but then I abandoned.
The cart is what’s called. That’s something that’s certainly that you want know to retarget to them (which means bring them back to the website) to get them to purchase something.
So Google has several different things, and they’ve got event enhanced e-commerce, which we’ll go over later, but event actions are here and are being tracked.
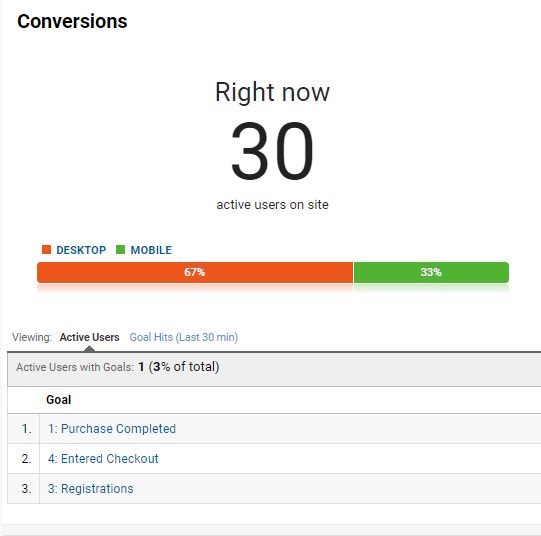
Now I want to take a look at conversions, see how many people have converted. It looks like they’ve got multiple goals that they’re tracking registrations enter checkout and purchase completed. So they don’t have any purchases completed, but these are goals that people have hit.
They’ve got 13 goal hits to enter the checkout, one, a four purchase completed, and three registrations in the last 30 minutes. So they have sold some products, which is interesting.
That’s the quick overview of the real-time Google analytics interface.
Hopefully, it was helpful and you can understand it a little bit better.
About The Author
Dave Burnett
I help people make more money online.
Over the years I’ve had lots of fun working with thousands of brands and helping them distribute millions of promotional products and implement multinational rewards and incentive programs.
Now I’m helping great marketers turn their products and services into sustainable online businesses.
How can I help you?

