I’m here today to talk to you a little about a little bit about analytics and how we use it to better help our customers grow their business through digital marketing. And even though we are partial to different channels, what I’m going to go through today is acquisition and all the different channels that you could potentially use and track to be able to understand where and how to make more money online.
So what I’ve got here is I’ve got up Google analytics, universal view, and this is actually the Google merchandise store view. If you go to Google and you type in “Google merchandise demo store,” you’ll be able to download access to the Google merchandise store. So you can see exactly what I’m looking at on your own computer and go through a couple of different things on your own.
Over here on the left side, and I said, we’re talking about acquisition today. So you’ve got real-time traffic audience, acquisition, behavior, and conversions today. We’re just going to go over acquisition. And this view that you see here in the middle is the acquisition overview.
You’ve got your top channels. So channels direct paid affiliate, other display, how many users in this timeframe? So this is in June of 2021, conversions e-commerce conversion rate and then acquisition. So, where most of the traffic comes from and then where all the conversions happen. Interestingly in this account there are only five channels.
If you have your own traffic in your own Google Analytics account, you could have eight or nine, depending on how you’ve got it structured and set up. Some of the ones that are missing here are social and also email. So if I change the timeline, maybe I’ll get a couple more, you know, go back to the first of the year, see if we’ve got some more acquisition through different channels. And sometimes Google Analytics takes a minute, but yeah, there we go.
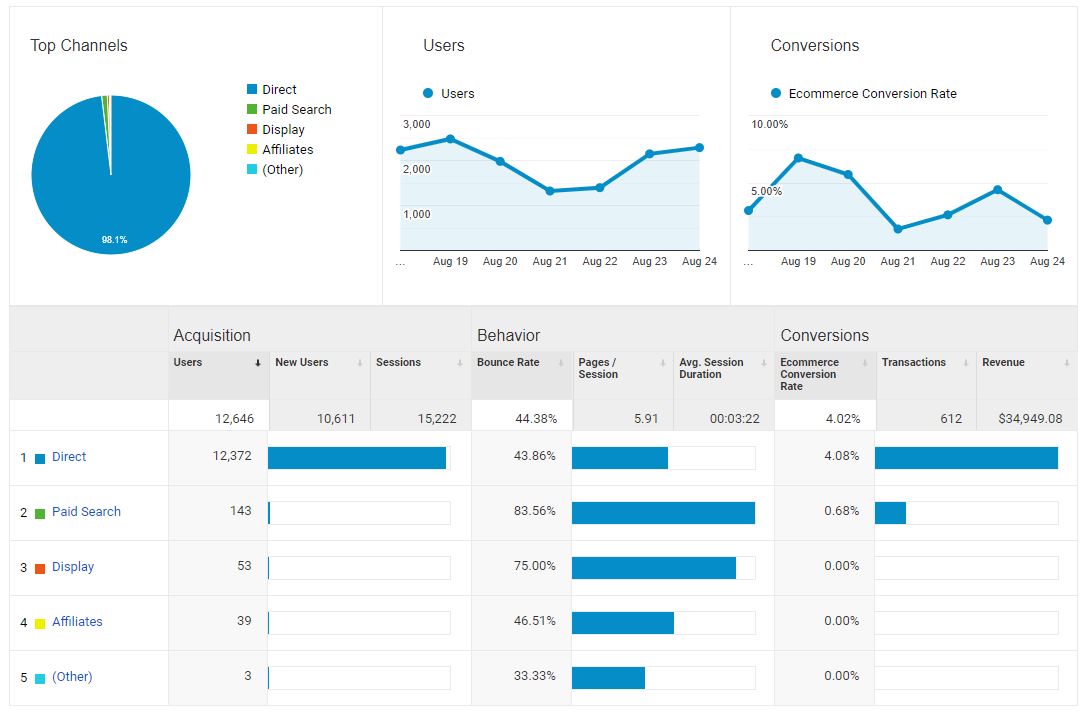
With the revised date range we now show social, affiliates, display, paid, search, other, all that kind of good stuff. And you can see the conversions conversion rate modifies over time. And yeah, that, that would be something we’d want to potentially look at as to why conversions were so low through there versus conversion rates over through here.
The great thing about analytics is it can help you analyze those kinds of things.
Let’s start with direct traffic. In case you don’t know, direct is when people actually go and type in www.google.com or aokmarketing.com or whatever.
Below that is paid search. Other is unclassified display or display ads. If you’ve ever seen on any of the websites, I’m sure you have affiliates or paid people who have different links to drive traffic to your site.
Organic search is if you actually Google it. And, and interestingly, they only 290 searches versus 266,000 a referral is if you’ve got a link on another website and then social the social.
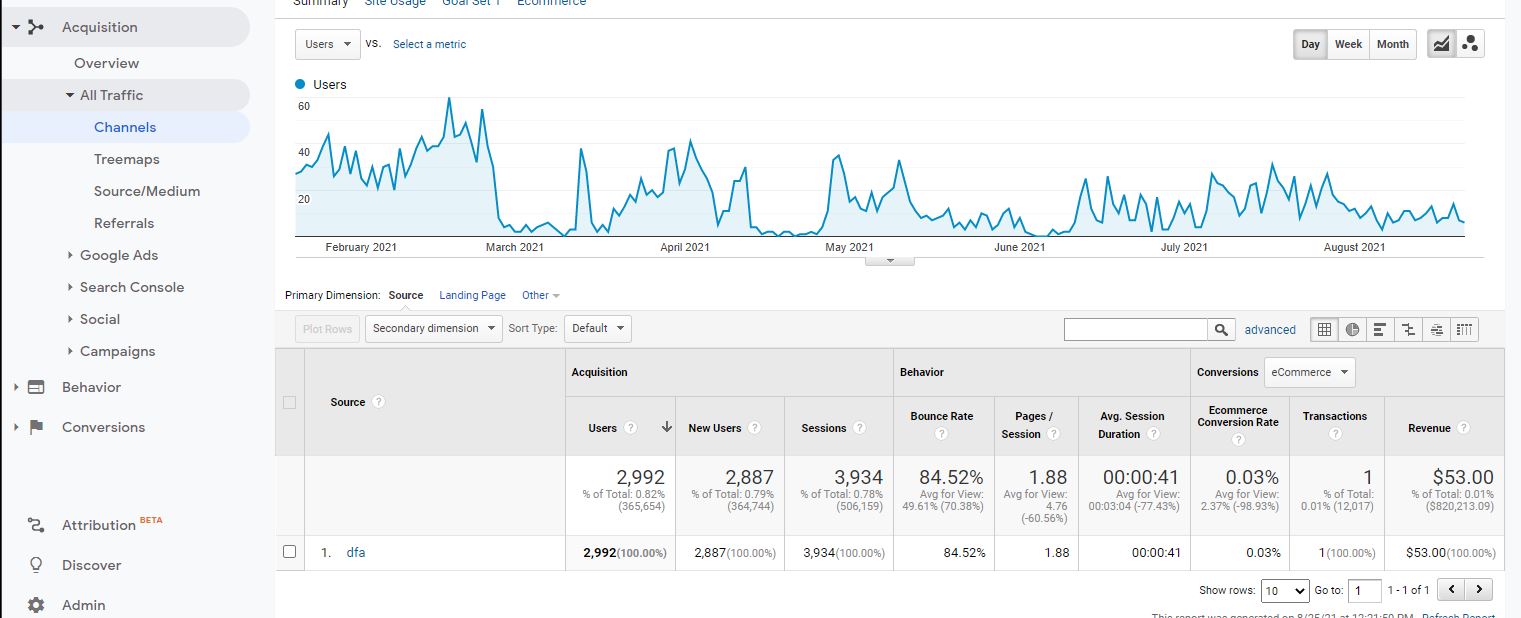
When we take a look at the number on the left side here, all traffic, and we actually take a look at the channels here on the left side. This gives you a more detailed breakdown of what we were just looking at.
It shows users, new users, sessions, bounce rate pages, outage duration, e-commerce conversion, transactions, and revenue. It is really interesting to see the revenue is, so I’m going to sort this column by revenue direct and then paid search and then other, so even, you know, it’s interesting to see even something as small as organic search, which only has 290 users had more revenue than affiliates at a thousand visits or 1900 visits and $183.
This is a good way to compare your revenue by channels.
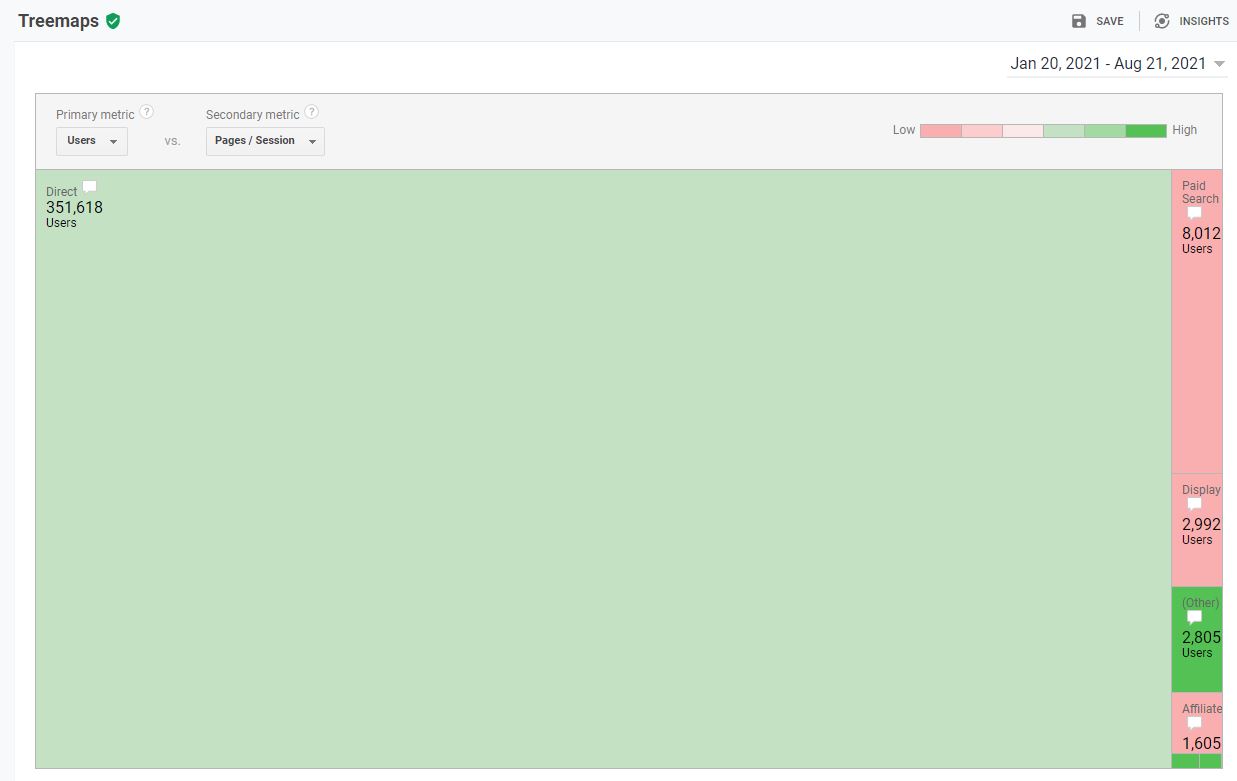
That’s over here on the left-hand side. And then you get into some different treemaps. I mean, it’s a little bit ridiculous because 93% of their traffic comes from direct, but you can see all the different users over here and the dirt and the channel grouping again, source medium.
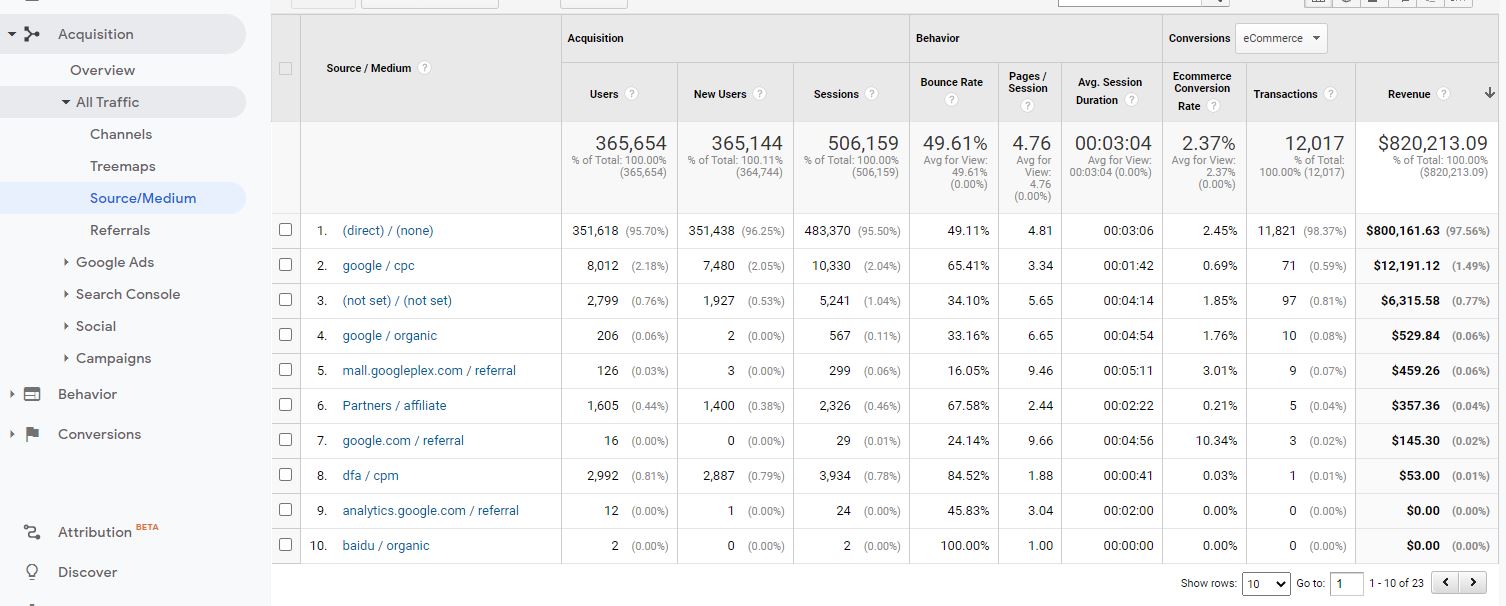
This basically talks about where the greatest traffic comes from direct non-Google CPC. If you’re running, say, for example, Bing ads, this would say, Bing CPC, you know, DFH CPM, that’s display partners, affiliate mail, or Malta Googleplex, that’s internal referrals analytics.
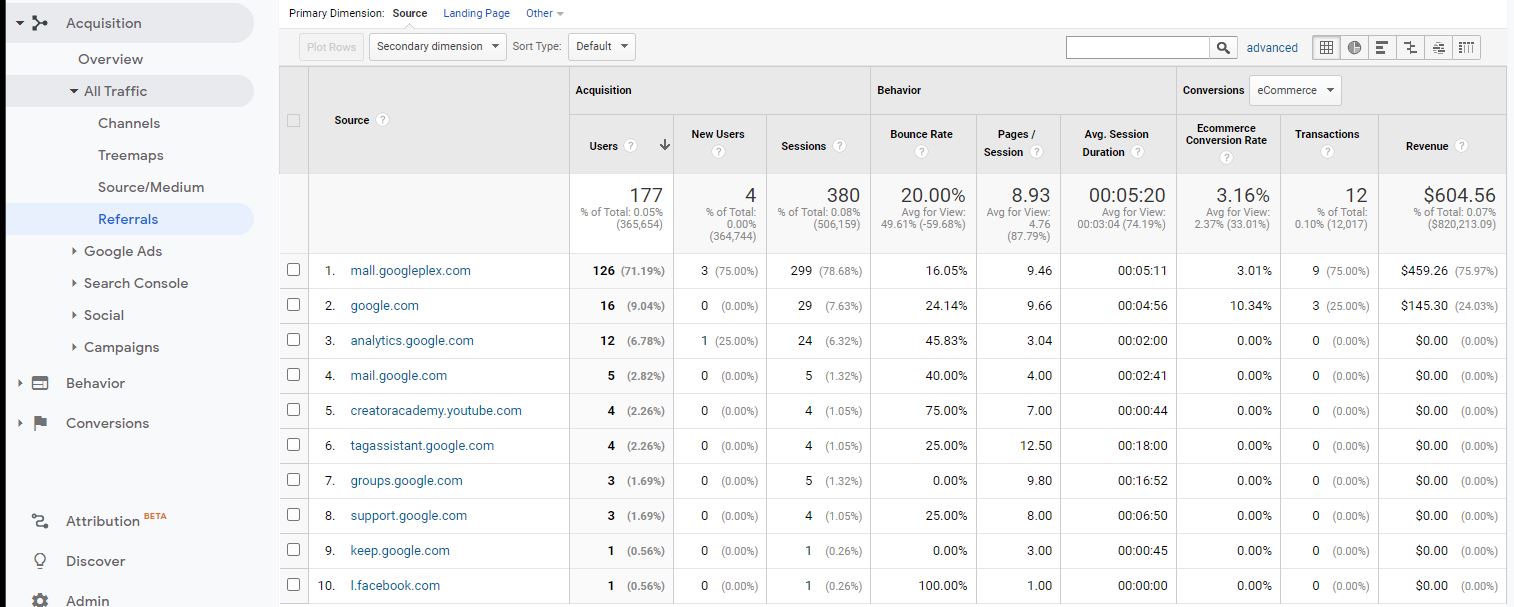
This shows us where they get some referral traffic. Cause it’s all internal, because remember this is the Google merchandise store. And in case I didn’t define it earlier. T-shirts, hats, and pens that say Google or Android or those kinds of things on them. That’s what this Google analytics view is showing.
Interestingly, if you just sort by revenue again, Google cpc.googleplex.com referral. So that’s our internal referral. So that’s, that’s where we are. And if you want to dig more into your referrals, here they are, you can see the referrals sessions were actually higher up. So, I imagine they took a link off and that’s why it no longer shows.
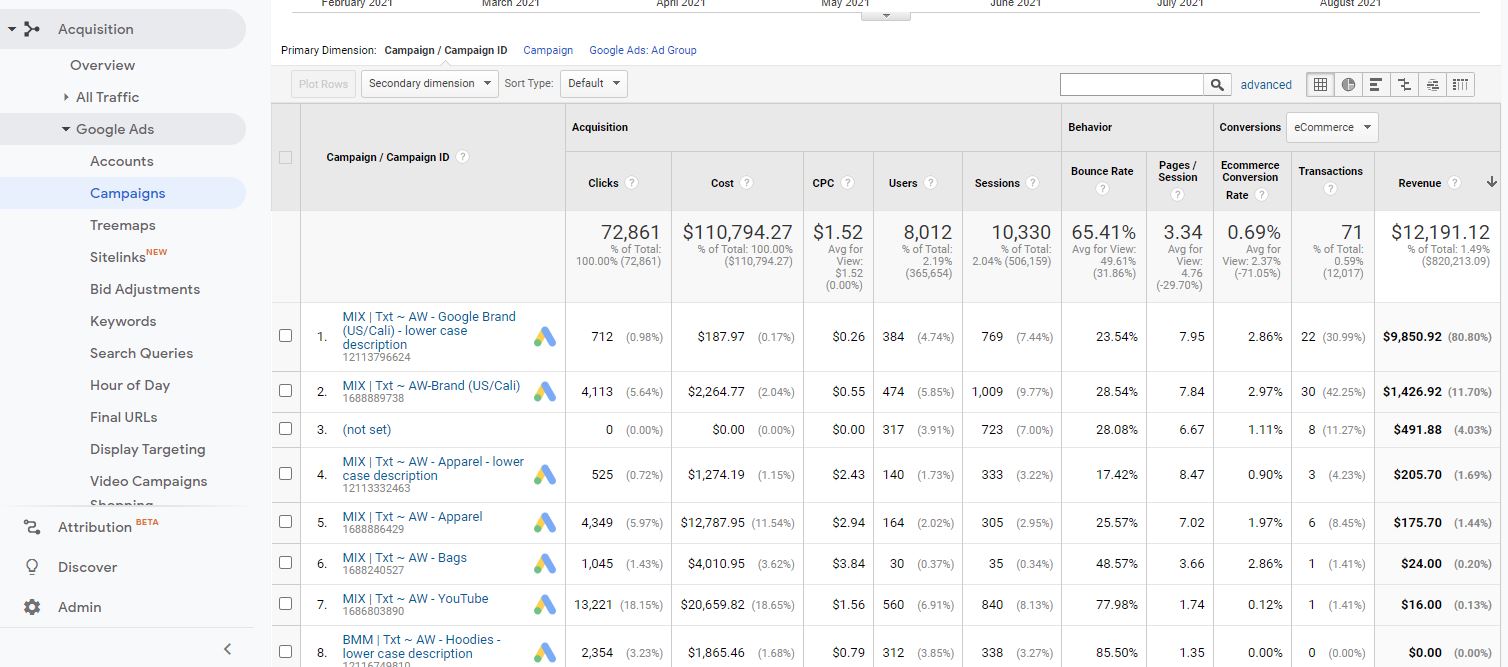
If you don’t have access to Google ads, there are different permissions for Google ads versus Google analytics. But you do have access to the analytics, and if you have access to analytics, but not Google ads, you can actually see it all here. Most of it here under the accounts. So this is the access or the name of the account, how many clicks total costs? Now this is Google. So there’s a bit of a joke internally, but it didn’t really cost them $110,000. What if it, did you take a look at the revenue over here? Right? It means they made $9,000 in revenue off $110,000 in costs.
If this was my marketing program, you got shut that down, right? That’s ridiculous to only get 10 cents on every dollar you spend. You might as well as sit in the corner and punch yourself in the face. You get more profit from that. And I’m sorry, as a recording, I probably shouldn’t say stuff like that, but really it’s you got to take a look at all of your platforms. Nah, way. I got to have a little fun with the videos too.
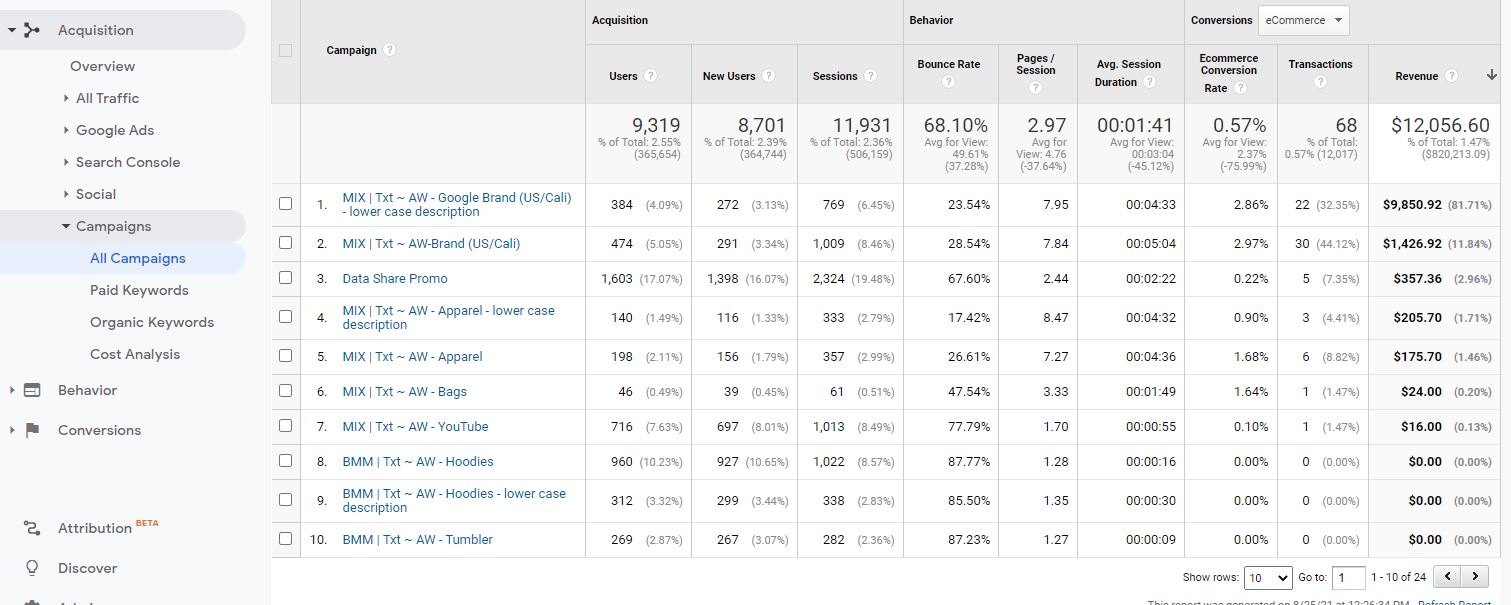
We can look at the campaigns themselves, they have these different structure. BMM is probably stands for broad modified match, broad match modified exe is probably exact match. So if you actually dig into these, these are exact match keywords. You know, ad-words hoodies as an example, and you go in there and there’s the keyword hoodies. All right. So you can see then don’t advertise much beyond that. But if we take a look back, what you want to do is you want to sort by revenue again.
If we go over here to the right-hand side of the $10,000 in revenue, this is our highest performing campaign mix, text outward Google brands. So there, they’re advertising for the Google brand lowercase. And so this has gotten the most traffic. So branded trucks, so completely different lesson, but Google AdWords. We often divide it up into branded traffic and non-branded traffic at the highest level, branded being, people are searching for your keyword terms, non-branded being kind of everything else. So let me move further down here into the treemaps again, not really helpful given the way they’ve got structured site links. So these are site links. So in your ads, you have different site links. Basically, they make you take up more real estate on the homepage when you actually are serving an ad. And these are the way the different clicks and revenue and costs have actually been by site link. And you see the eye 10, 10, whole dollars off a $12,000, approximate cost.
So bid adjustments, these are different things. You know, how many clicks, what different types of bid adjustments. And actually interestingly, they’ve got mobile devices, computers, and tablets, and you can see again, if we sort by revenue top-line is again, this same one and computers resulted in all that revenue.
If we expand out this one here to see the ad-words branded US, California, again, mostly computers, little bit of mobile device revenue. So something to look at, and then if you actually want to sort and look just by keyword, that’s all here too. You can sort again by revenue, and you’ll see the branded phrase, Google merchandise store, Google apparel, et cetera, et cetera, Google t-shirts, it’s all branded keywords. But you see, when you actually look at it, they do have other keywords that they’re advertising for. They’re just not generating any revenue over here on the right a search queries. So these are the actual search terms that people have entered into Google. This is actually very helpful if you’re doing non-branded my searches, a place to kind of harvest more non-branded search terms. So YouTube or merged t-shirt YouTube store, interestingly vintage clothing. But again, when we come down to the revenue side, see what search terms are actually turning know, generating cash for them.
It’s all branded searches taking a look at the hour of the day. This is interesting because there’s, I know there’s store is global. So you know, as you can see, if we sort by sort by revenue going backwards, there we go. So 12, so hour of the day, middle of the day 12, and then 20 so eight o’clock at night, nine in the morning, two o’clock in the afternoon, 10 o’clock, one o’clock. And these, you know, these times are based on whatever the settings are that the individual account is. And I’m assuming it’s going to be on west coast time, California time. And that’s where it is. But day of the week, most revenue day, too. That’s interesting. So, you know, Tuesdays depend on how they have it structured, I believe it’s Tuesday and then final URLs you know, where people actually land and what final URL they go to and see what is the highest converter. And it’s taking a while to actually sort it. There we go. So this is the shop.google merchandise store.com Google redesigned shop by brand Google. So clicking on that, you can then dig in a little bit deeper as well, and you can see it actually was generating a lot more revenue for them before for March. And if we actually, oops, don’t want to go there. I want it to actually click on it and see if it’ll kick us over to that page.
There it is. So you can actually see the Google official merchandise store. Here’s some of the Google products that you could potentially buy that we’re talking about looking at this store, but anyway, I digress.
On to display targeting. There are many different ways they could target on display, but they’re not running any ads, video campaign, shopping campaigns, same thing.
And the next part within the acquisition overview is actually search console.
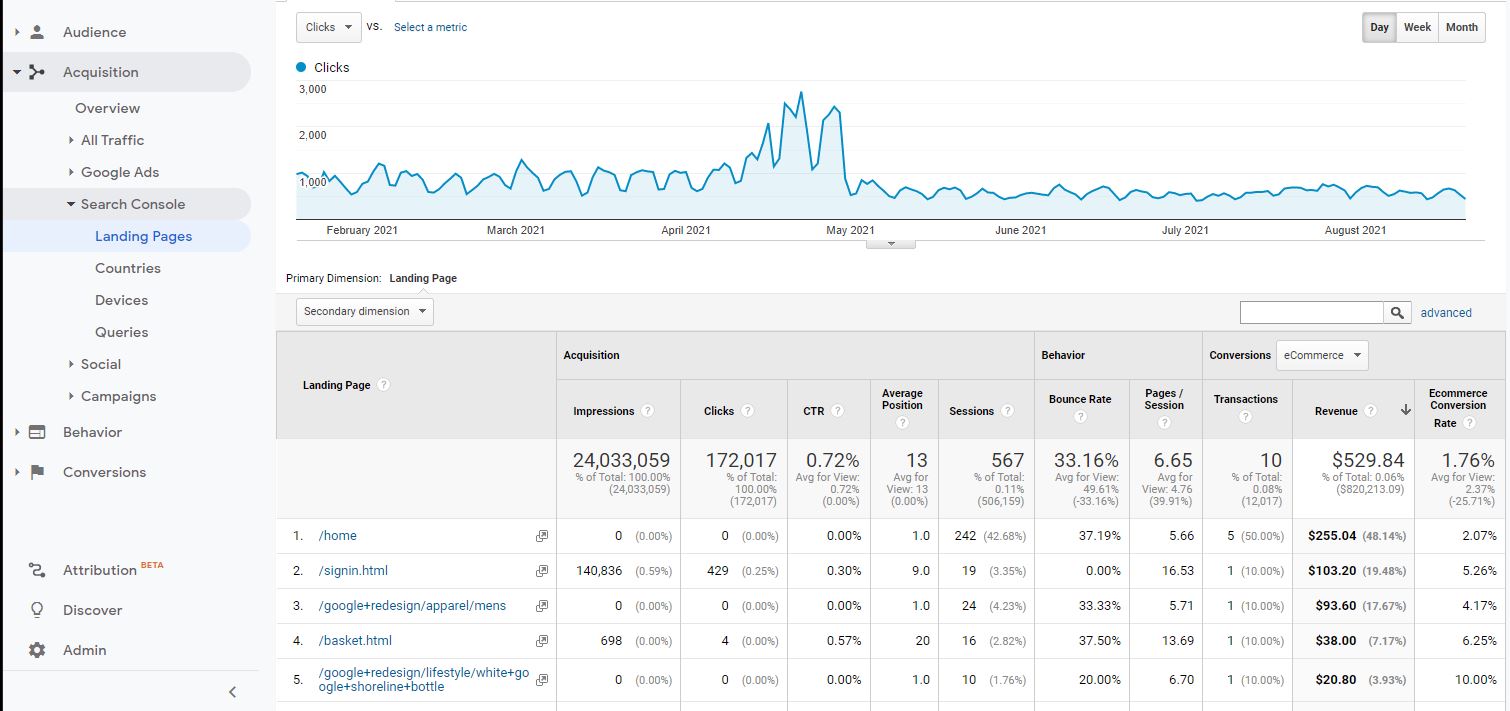
So if you connect up search console into your Google Analytics, it’ll actually import data from Google search into your into your actual Google analytics. So you can sort by, you know, for example, landing page. So these are the way that the landing page the most popular name landing pages, and this is what it is, this dyno game T interesting marina layer T so available quantities and everything they’ve gone in their store, but that doesn’t actually matter in terms of revenue.
When you take a look at revenue, their homepage desk at Google design apparel men’s, and then this one, this bottle has actually generated some revenue as well. Oh, it did in the past anyway.
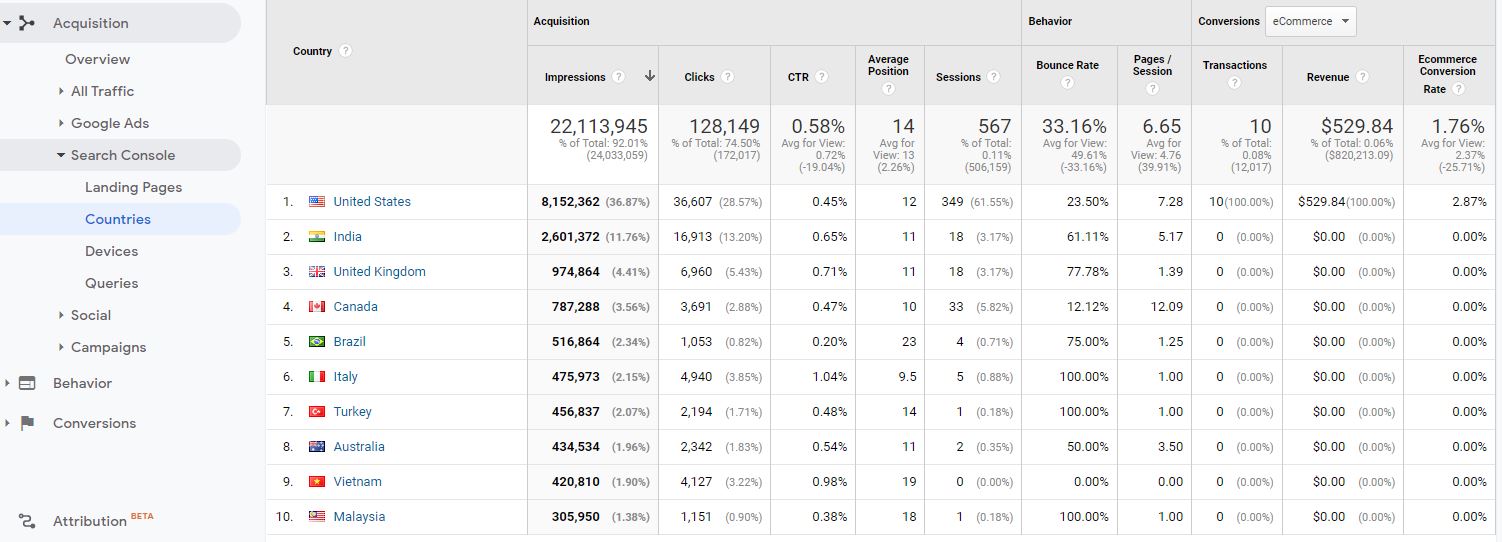
The other thing is to take a look at countries, Google search console also tells you where traffic has originated and which country that it’s coming from. And this can be very helpful depending on where your marketing is, because this is for all searches. This isn’t just for what you’re doing on your paid search side of things. But if, for example, you know, you take a look by revenue, all the revenues in the United States. But if, for example, there was some revenue on Turkey, or if there’s revenue in Canada, you would then potentially look at all right, does it make sense to increase our our advertising there or try and improve our our presence in those places.
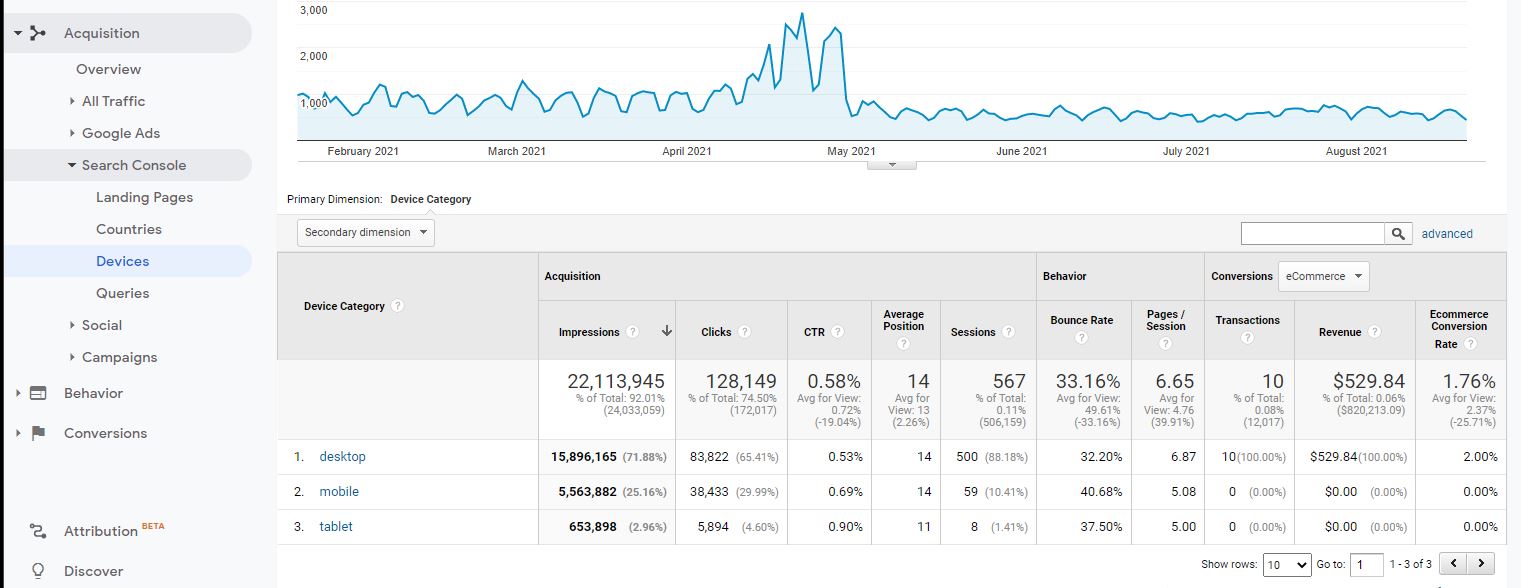
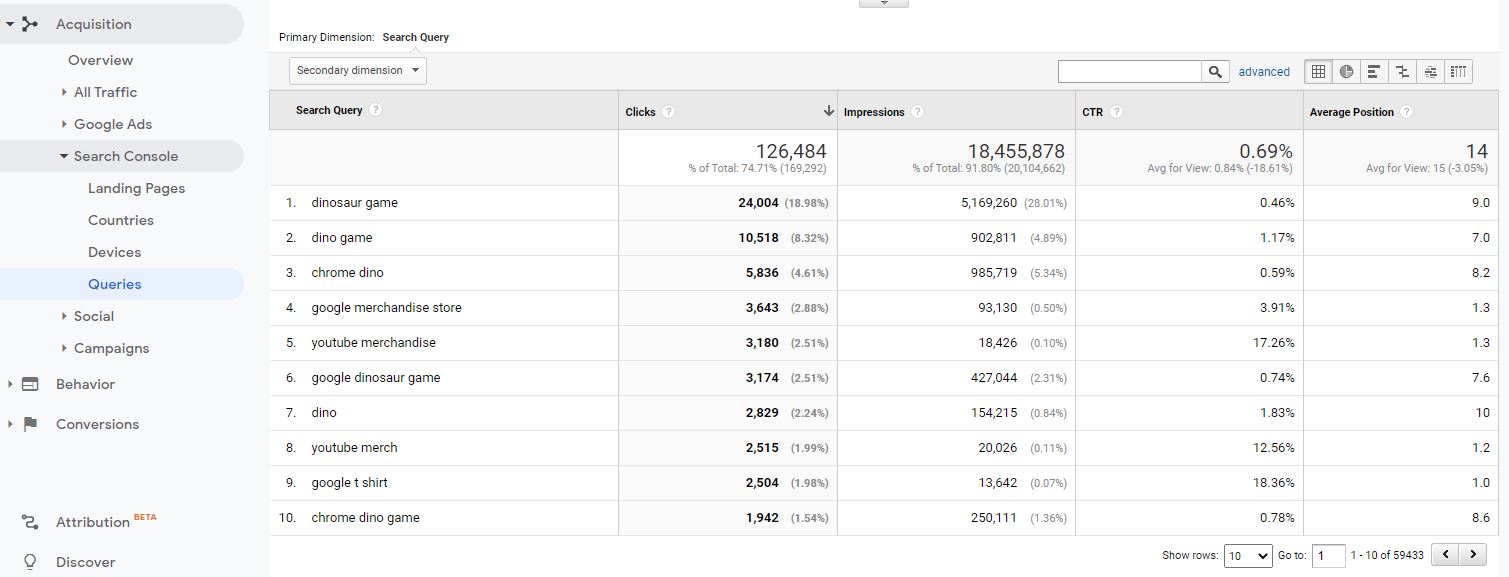
Now, the next part here on the search console is devices, depending on which device now, the vast majority of conversions we see for this type of product tend to be desktop. And as you can see, it’s also desktop. But it really depends on what you’re selling, how you’re selling it and what you’re measuring for conversion. So this is e-commerce conversion for t-shirts and hats. Desktop will always be the, the most popular one there. And if we go over here to the search console search queries, as opposed to the search queries from paid ads, you’ll see where the search queries from.
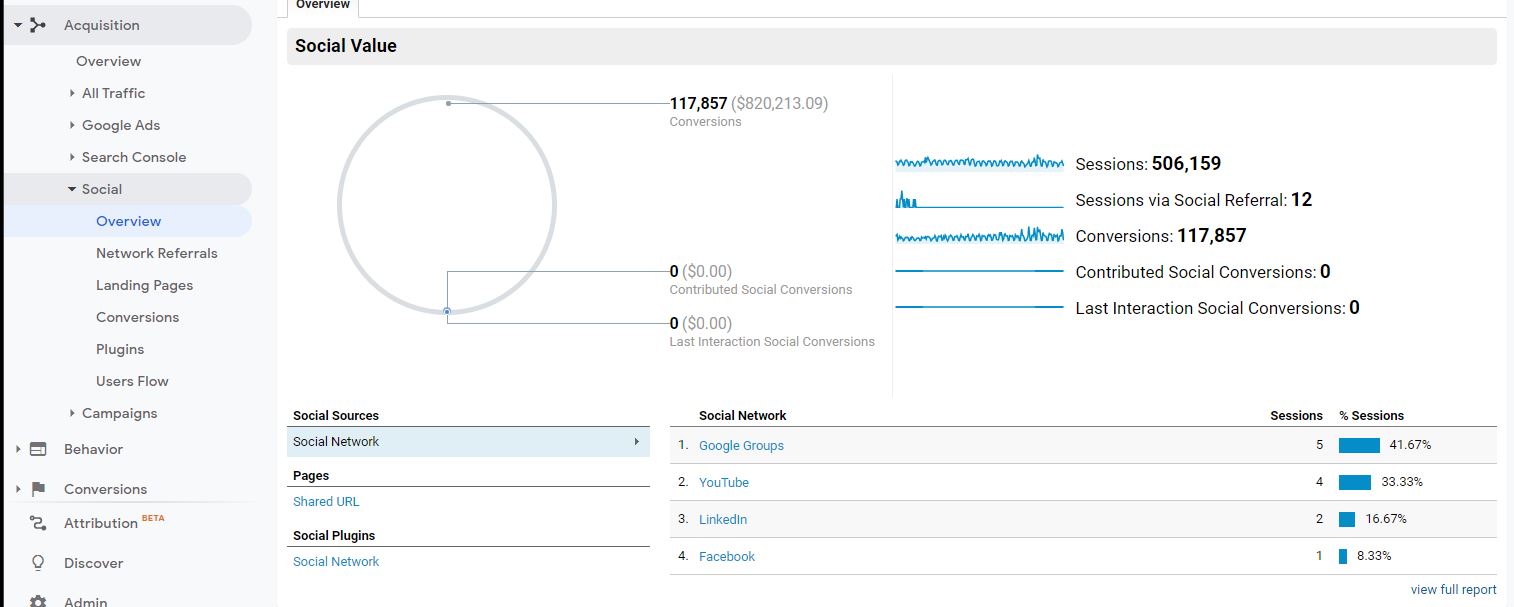
And interestingly, the dinosaur game has resulted in the most search queries for this merchandise store even way above Google merchandise store. So that’s probably why that that shirts that we were looking at before that has the dinosaur game on it was as popular as it was. Now, if we actually take a look at the next part of acquisition is social. How many people came to different this page from different social networks? Google groups is obviously got the most, I mean, these are tiny numbers, but Facebook, LinkedIn, YouTube. And then if you had more social traffic, you would have, you know, Twitter and Instagram and all the others listed here as well. Those are going to be very little information here in terms of network referrals. And then, you know, landing pages where people are actually getting to, but this is all important information.
If you use social as a large channel of yours, and then what kind of conversions you generated from that, unfortunately they didn’t have any, and then where the user flow come in as they’re hopefully be a little bit of user flow. Yeah. So there’s a little bit of useful. This is actually a flow.
There’s actually a very interesting graph depending on that. So you can see people who came in from YouTube shop by brand, and then they all dropped off. That’s what this red bar is. So if you’re looking at this in your own, that’s what it actually is. And then the last part is your campaigns also, depending on how you’re actually structuring your campaigns, this talks about Google ads as well.
But suppose you have different other campaigns running like this data share promo. In that case, this is another campaign actually generated a little bit of revenue and a little bit of traffic, but at T sorry, a little bit of transactions, but a ton of traffic relative to the other campaigns that they’re running.
So if we sort again by revenue, there it is right in there, but you can do some interesting things on this. You can actually take a look at the source and see what the source of that traffic is within the, within the campaign and within the campaigns you’re running. So, you know, Google and then partners. And then if you’ve got source medium, that can actually tell you, you know, within Google and within partners, what the medium was as well. So Google CPC and partner affiliate you know, if you want to dig into the paid keywords again, a case there’s more than just Google ad words coming in.
If, say for example, there was Bing ads or Microsoft ads coming in as well, that will often show here, but we’ve already gone through that. On the other side. So taking a look at these keywords, and by the way, the little plus sign is a modified broad match indicator, which means that it’s, it’s not just a broad hoodies, but it’s a little bit narrower than that.
Now, some of the things were where it could also get interesting as under the organic keywords, as you’ll notice, the vast majority of them are not provided, but these ones you know, shop Google merchandise store is an organic keyword as well. And then at the end here as the last part is the cost analysis.
Cost analysis can give you an idea of your return on ad spend. So the interesting thing is in this, it actually says your cost is $111,000. Your return on ad spend is 454%, which I’m not sure how that is calculated because, to be honest, that is completely wrong. So I’ll have to figure out what exactly they’re doing over there. It’s the return on the ad spend with the view. But yeah, so, cause he can’t get $110,000 in revenue per click of $6 and 99 cents. So there’s obviously something going on here, but you know, when you’re actually doing this for yourself, some of these numbers you can use, but you can also use them manually. So nothing like finishing off on a bunch of data that doesn’t necessarily make sense.
So the important things for you to remember is when you’re here in the acquisition overview, take a look at where your traffic is coming in through the different channels. And this overview is a nice view of taking a look at the e-commerce rate and the number of transactions over here, easy rules of thumb, your paid search should be converting better than your organic search.
So in this case, that’s not actually happening, but it should also be converting then your better than your direct traffic to, but you will often see the vast majority of your traffic from organic and direct and that this, this is no, no different. Now the interesting thing is there are some social and some referral conversions as well, but the traffic numbers are so small. You don’t have to really try and get those up. So that’s it. Oh, one other thing you can also do some channel grouping.
If you wanted to, you can also figure out your top sources and mediums, and you can also change your goals. So instead of doing e-commerce, which we were running through, you can do purchase completed, which should run some similar numbers. But if you had, for example, registrations, you were driving registrations and said instead, that would give you different numbers over here.
Hopefully that Google Analytics Acquisition Overview was a little bit helpful. Hopefully, there’s something there you can take away to your own Google analytics, and if there’s anything we can ever do, please reach out, have a great day.
About The Author
Dave Burnett
I help people make more money online.
Over the years I’ve had lots of fun working with thousands of brands and helping them distribute millions of promotional products and implement multinational rewards and incentive programs.
Now I’m helping great marketers turn their products and services into sustainable online businesses.
How can I help you?
