Introduction
In the world of digital marketing, understanding user behavior is key to optimizing engagement and conversion. Traditional analytics (like page views and bounce rates) only tell part of the story. Modern marketers are increasingly turning to website heatmaps, session recordings, and clickstream analysis to gain deeper insights into how users interact with their websites. These tools provide visual and granular data on user behavior – revealing what visitors do, how they navigate, and often why they behave that way. This comprehensive guide will demystify each concept, explain the insights they offer, and show how to leverage them for marketing strategy. We’ll also compare popular tools (free and paid), discuss when these methods are worth the investment for various use cases, and highlight best practices (and common mistakes to avoid) to help you make the most of these techniques.
Website Heatmaps: Visualizing User Engagement
What Are Heatmaps? Heatmaps are a visual representation of user interactions on a webpage, using color gradients to show which areas get the most attention and engagement. “Hot” colors (reds/oranges) indicate high engagement (e.g. frequent clicks or views), while “cool” colors (blue/green) show low engagement. Heatmaps condense complex interaction data into an intuitive overlay on your page, instantly highlighting where users click, tap, move their cursor, or how far they scroll. There are several types of heatmaps commonly used in marketing and UX analysis:
-
Click Heatmaps: show where users click (or tap) the most on a page. This reveals which buttons, links, or images attract attention – and which are being ignored.
-
Scroll Heatmaps: display how far down users scroll on a page, usually as a color gradient from top (most viewed) to bottom (least viewed). This helps determine whether important content is seen by visitors or if it falls “below the fold” (often indicating many users never scroll that far).
-
Move/Hover Heatmaps: track where users move their mouse cursor on desktop (often a proxy for eye attention). Clusters of warm color can indicate which sections draw user focus, even if no click occurs.
-
Attention or Time Heatmaps: (offered by some tools) combine scroll position and time spent to show which sections users linger on the longest. This can reveal if users actually read or consider the content in a section, not just scroll past it.
How Heatmaps Work: Heatmap tools aggregate data from many user visits to your page and overlay the results as colored areas. For click maps, each click is recorded and plotted – clusters of clicks produce “hotter” spots. Scroll maps record how far each user scrolled; the tool calculates what percentage of users reached each part of the page, coloring it accordingly. The resulting heatmap is typically an image or an interactive overlay on your site that visually highlights behavior patterns. Because data is aggregated, heatmaps show general trends rather than single-user actions. They work best with a decent sample size of visitors to ensure the patterns are reliable (with low traffic, the “hot” spots might be based on too few users to be broadly meaningful).
What Can Heatmaps Reveal? Heatmaps quickly answer questions like: Where are users clicking? What do they ignore? How deep do they read or scroll? For example, a heatmap might show that users overwhelmingly click a navigation menu but ignore a promotional banner – indicating the banner is either not seen or not interesting. Or a scroll heatmap might reveal that only 30% of visitors reach the call-to-action (CTA) at the bottom of a long landing page, suggesting that the CTA should be moved higher or made more enticing. In one case, an e-commerce site discovered via heatmaps that users were ignoring a key CTA that was placed in a low-visibility area, prompting a redesign of the page layout – and the simple change boosted conversions. Heatmaps can also uncover dead clicks (users clicking on elements that aren’t clickable, like plain text or images), which often signals confusion in the UI. For instance, if many users click on an image expecting it to enlarge or be a link, that may indicate you should make it clickable or clarify it. Conversely, if an important link or button isn’t getting clicks, it might be because it’s not prominent enough or looks inactive. In sum, heatmaps help you literally see what attracts users’ eyes and fingers on your page and what they overlook.
Why Use Heatmaps – Marketing Insights: For marketers, heatmaps provide actionable insights that raw numbers can’t. Instead of just knowing a page’s bounce rate or time-on-page, you learn which parts of the page drive engagement and which parts are wasted space. This has direct implications for conversion rate optimization (CRO) and content strategy:
-
Optimize Page Layout & CTAs: Heatmap data guides you on where to position your most important elements. Placing CTAs “above the fold” in areas that show as hot spots can improve conversion. If a heatmap shows users focus on a particular image or section, you might relocate your signup button or key message near that area. Actionable tip: Use click heatmaps to ensure that your CTA buttons are in the zones with highest engagement, and not in cold spots where they go unnoticed. One study noted that businesses using heatmap analysis were able to improve conversion rates by 35% on average by making such data-driven adjustments.
-
Improve Content and UX: Scroll and attention heatmaps help assess if users actually see your content. For example, if only a small fraction of users scroll far enough to see your pricing table or a critical paragraph, you might need to shorten the page, rearrange content, or add teaser elements that entice deeper scrolling. Heatmaps can highlight “content blindness” issues – e.g., if a section that you consider important is mostly blue (cold), it indicates lack of user interest or visibility. Marketers can use this insight to rewrite headings, break up text, or use visuals to draw attention. Heatmaps essentially let you gauge visitor interest and engagement visually, so you can align your content placement with user behavior.
-
Identify Friction or Distraction: By visualizing clicks, you can find points of friction. For example, a cluster of clicks on a non-clickable element (perhaps an icon or image) might mean users think it’s a button – a potential UX issue causing frustration. Likewise, if a navigation menu or filter gets an unexpectedly high concentration of clicks (hotter than even your main CTA), perhaps users are struggling to find something and keep clicking around. These clues help you remove obstacles. For instance, heatmaps can highlight dead clicks and confusing elements, prompting you to fix or remove them and smooth out the user journey.
-
Support A/B Testing Hypotheses: Heatmap insights often feed into experimentation. If you observe that an important link is barely noticed (a cold area), you might form a hypothesis that changing its color or position will increase engagement. You can then A/B test those changes. The heatmap doesn’t prove the solution, but it very clearly flags where a problem might be. It essentially provides the “why” behind metrics – e.g., conversion rates are low because users aren’t seeing or clicking the conversion button in the current design. Armed with that knowledge, marketers can make evidence-based design tweaks and then test their impact.
Are Heatmaps Worth the Investment? In many cases, yes – especially for pages where conversion or engagement is critical (landing pages, product pages, signup forms, etc.). Heatmaps excel at pinpointing where users interact most, which is invaluable for conversion optimization. For example, Bear Mattress (an e-commerce company) used heatmaps during a CRO project and achieved a 24% uplift in successful purchases and a 16% revenue increase within 19 days. Those are significant gains directly tied to insights from visualizing user behavior. If your marketing goals include improving a page’s performance (more clicks, more sign-ups, more sales), the visual feedback from heatmaps can quickly justify the time or cost.
That said, the value depends on your use case and scale. For a small blog or informational site with minimal conversions, a heatmap might be “nice to have” but not as game-changing – though even then, a free heatmap tool could reveal how readers engage with your content (e.g. do they scroll through your long articles or bail halfway?). On the other hand, for an e-commerce or SaaS website, heatmaps are often well worth it – small design improvements (like moving a button or trimming content) can yield meaningful conversion lifts, easily covering the cost of a heatmap tool. Importantly, there are free options (like Microsoft Clarity) that make basic heatmaps accessible to anyone, which means even budget-conscious teams can experiment with them. In short, heatmaps are a high-impact, relatively low-effort method to visually audit your webpages’ effectiveness, and they often uncover insights that lead to quick wins in marketing performance.
Session Recordings: Replaying User Sessions
What Are Session Recordings? Session recordings (also called session replays) are virtual video playbacks of real users’ visits to your website. Essentially, the software records everything a user does during a session – mouse movements, clicks, taps, scrolling, typing into forms, page navigations – and then lets you watch it later as if you’re looking over the user’s shoulder. Unlike heatmaps which aggregate data, session recordings show individual user experiences in full detail. It’s like a DVR for your website: you hit “play” and see exactly how a user interacted, moment by moment. This includes dynamic interactions such as opening a dropdown, moving through a multi-step form, or encountering an error message. Session replay tools reconstruct these events typically by logging the Document Object Model (DOM) changes or user input events and then playing them back in sequence.
From a marketer’s perspective, session recordings are a qualitative tool that provides rich insights into why users behave as they do. You’re not just looking at numbers or hotspots; you’re watching the user’s journey unfold – which pages they visit, where they move the cursor, how long they hesitate before clicking, and where they might get confused or frustrated. As a result, recordings help you catch issues and observe behaviors that traditional analytics might miss. For example, you might see a user repeatedly clicking a disabled “Submit” button (a sign of frustration), or hovering back and forth between two product images (indicating indecision or lack of information), or abandoning the process at a certain form field. All these nuances provide clues to improve UX and conversion funnels.
What Do Session Recordings Reveal? In short: they reveal the story behind user actions. By watching replays, you can discover: Where do users struggle? What path do they take through your site? Which elements do they interact with repeatedly? Do they attempt actions that don’t result in anything (e.g. clicking text or trying to select an image)? Do they experience obvious bugs or delays? Some specific things marketers and UX teams look for in session replays include:
-
Friction Points: e.g. repeated clicks (sometimes called “rage clicks”) on an element, which could mean the element is unresponsive or not doing what the user expects – a classic sign of frustration. If you see rage clicks on a field or button, it’s a red flag that something isn’t working or is confusing.
-
Dead Clicks: instances where users click an item that isn’t interactive (like clicking on a label or an image that isn’t actually linked to anything). This often means the user thought it was clickable. Such insights might prompt you to make that element clickable or redesign it so it doesn’t seem interactive.
-
U-Turns and Scrolls: watching how users scroll and navigate can tell you if they’re smoothly finding what they need or if they seem “lost.” For instance, a user might scroll down, then back up, then down further – perhaps looking for something they missed. Or they might bounce between a couple of pages (back-and-forth navigation), suggesting they didn’t find what they expected on those pages.
-
Form Abandonment: session recordings can show exactly where a user gave up in a signup or checkout form. Maybe they hesitated on a certain field (unsure what to enter), or clicked “Submit” and nothing happened (maybe an error that wasn’t obvious). Seeing this allows you to identify which step in a process causes drop-off in a very concrete way (far beyond a simple form analytics stat).
-
Content Engagement: you can observe if a user actually scrolls through that long landing page or if they rapidly skim and leave. Did they play the video embedded on the page? Did they open the FAQ accordion? These micro-interactions are all visible in recordings.
-
Technical Issues: Sometimes you’ll discover browser-specific problems or bugs by watching replays – e.g., a button not working on Safari, or a page element overlapping another on a small screen. Session recordings often reveal when a user encounters a broken element or error (you might see them repeatedly trying an action with no result, or pausing and then exiting). Some advanced session tools even flag these by detecting JavaScript errors or “rage clicks” automatically.
Crucially, session recordings help build empathy for the user experience. Instead of abstract data points, you’re witnessing a real person’s experience. As one conversion expert put it, session replays let marketers and product owners “see in raw form the exact journey and elements that throw [users] off,” enabling you to empathize with your visitors’ experience. This empathy is powerful – it often highlights pain points that might not be obvious from numbers alone.
Why Use Session Recordings – Insights for Marketing Strategy: Session recordings provide context and “why” answers that complement your quantitative data. Here are key ways they inform marketing and optimization efforts:
-
Identify and Fix UX Roadblocks: By observing real user sessions, you can pinpoint where and why users drop out of your funnel. For example, suppose your analytics show a high drop-off on the checkout page. A session replay might reveal that users are confused by an “Apply Promo Code” field or an unclear error message about an address. In one case, a retail e-commerce site found that many users were abandoning the checkout. Watching session recordings revealed the cause: users were confused by ambiguous wording in the payment options. The company simplified the language and improved the visual layout of that section, resulting in a 20% increase in completed transactions (conversions) after the change. This kind of insight is pure gold for marketers focused on conversion rate – it directly uncovers what’s wrong in the user flow so you know exactly what to improve.
-
Improve Conversion Funnels: Every marketing team has key user journeys (like going from product page to purchase, or from landing page to sign-up). Session recordings allow you to watch those journeys unfold. You might discover, for instance, that users coming from an email campaign scroll quickly and ignore the intro text on your landing page, indicating that your headline isn’t grabbing attention. Or you might see that most users navigate to a certain informational page before converting, suggesting that content is crucial and should be made more prominent. These observations help optimize each step of the funnel. Essentially, session replays take funnel analytics a step further – not only do you see where users drop off, you get clues why, which leads to more effective fixes (and subsequent marketing strategies to address those drop-offs).
-
Enhance User Experience (and Satisfaction): Marketers know that a smoother user experience often means better conversion and brand perception. Session replays are an excellent tool for UX refinement. By seeing where users hesitate, backtrack, or get frustrated, you can streamline those interactions. For example, if recordings show multiple users pausing at a particular form field (maybe “Company Name” in a signup) and then quitting, perhaps that field is intimidating or not well explained – you might remove it or add a hint. Improving these micro-experiences can lift overall conversion rates. Plus, a site that “just works” and is easy to use will naturally support your marketing goals (users trust it, complete purchases, return again, etc.). In fact, many marketers use session insights to collaborate with design/development teams on conversion-oriented UX changes – it’s concrete evidence to drive those decisions.
-
Validate Changes and Hypotheses: After you make improvements (or run A/B tests), session recordings can be used to validate that the user behavior actually improved. For instance, if you changed a button color or placement based on earlier recordings, you can watch new session replays to see if users now notice the button and click it more readily. This qualitative check complements the quantitative results of your A/B test or metrics tracking. It helps ensure that the user experience is indeed better, not just the numbers.
-
Customer Support and Journey Understanding: Sometimes marketing teams also use session replays to understand individual customer stories, especially for high-value prospects. For example, if a user complained or gave feedback like “I couldn’t complete my purchase,” you can (with appropriate privacy measures) find their session recording and see exactly what happened. This can inform not only that one case, but also reveal if others might be hitting the same snag. FullStory (a session replay tool) users often mention how valuable this is for customer support – “we can see what changes were made and where… to support customers daily”, as one user noted. From a marketing standpoint, this level of insight helps ensure you’re not losing potential customers due to unseen hiccups.
Are Session Recordings Worth the Time & Cost? Session replays can be immensely valuable, but they do require an investment of time to review (and some tools can be costly for large volumes). Whether they’re “worth it” depends on your website’s complexity and your specific goals:
-
For complex or mission-critical user flows, yes. If you run an online store, a SaaS product, or any site where conversions matter, the qualitative insights from session recordings are often worth every minute spent. Identifying one major UX problem in a checkout flow, for example, could increase sales by a large percentage – easily paying off a month’s tool subscription or the hours spent analyzing. In practice, marketers often don’t watch every recording, but rather use smart filtering: e.g., focusing on sessions with certain behaviors (like “users who didn’t complete checkout” or “sessions longer than 5 minutes on page X” or “sessions with rage clicks”). This way you zero in on the most relevant replays. Many tools also provide alerts or summaries (like tagging recordings with “rage click detected” or “javascript error”) to direct you to potentially problematic sessions. This means you don’t have to watch thousands of videos – just the ones likely to yield insights. When used in this focused way, the time investment is very manageable compared to the value of the findings.
-
For simple sites or early-stage projects, perhaps use selectively. If your site is very small or you have limited traffic, you might not get a huge bang-for-buck from watching sessions of every visitor. However, even for small sites, a few session samples can be illuminating (and there are free/cheap tools that allow a limited number of recordings). For example, a startup with a beta landing page might watch 10–15 session replays of visitors to see if they scroll and understand the value prop, which is great qualitative feedback before a big campaign. As your traffic grows or if you’re noticing problems in metrics, you can ramp up session analysis accordingly.
-
Tool cost considerations: There are both free and paid solutions for session recordings. Microsoft Clarity, for instance, offers unlimited session recordings for free with no traffic sampling (they record all sessions by default). This makes it extremely cost-effective to at least try session analysis. Hotjar provides session recording on a freemium model (free up to 35 sessions/day captured, then paid plans for more). Paid specialist tools like FullStory or Decibel Insights can get pricey, but they also offer advanced capabilities (like more storage, faster search, AI insights). FullStory, for example, has a free tier for small usage, but its business and enterprise plans (which unlock heavy-duty features) can exceed $350 per month in cost. These high-end tools tend to be worth it for larger companies where the scale of user interactions (and potential revenue at stake) is huge – plus they often double as analytics platforms. For most marketers at small-to-mid scale, however, you can start with free or affordable session recording tools and still gain tremendous insights. The bottom line: if you have an online funnel that you’re investing in (via ads, SEO, etc.), not investing some time to watch how users experience that funnel is a missed opportunity. The qualitative understanding you gain can significantly improve your marketing outcomes (better conversion, lower drop-offs, higher customer satisfaction), making session recordings well worth it in the majority of cases.
Clickstream Analysis: Understanding User Paths and Behavior
What Is Clickstream Analysis? Clickstream analysis is the practice of tracking and analyzing the sequence of clicks or actions a user takes as they navigate through your website (or app). In other words, it’s following the “stream” of clicks – the path from one page to the next, and so on – for each user, and aggregating that data to see overall patterns. Every website naturally generates clickstream data (through web analytics platforms or server logs): it includes things like which page a user entered on, what link they clicked next, how long they spent on each page, and where they exited. Clickstream analysis typically focuses on key journey metrics such as entry pages, exit pages, page-to-page paths, click sequences, and dropout rates at each step. Essentially, it answers: Where do users come from, where do they go on the site, and in what order?
Unlike heatmaps or session replays, which are more visual/qualitative, clickstream analysis is usually quantitative and often presented through flowcharts or funnel diagrams. For example, web analytics tools might show a “Users Flow” report – a chart of boxes and arrows illustrating how a cohort of users moved from the homepage to a category page to a product page, and what percentage dropped off at each step. Another example is a conversion funnel report (e.g., how many users who added to cart actually completed purchase – and where the rest dropped off). By capturing every click and page transition, clickstream data gives a comprehensive map of user navigation behavior. It can be very detailed: including time spent on each page, clicks on specific links, the sequence order of pages visited, and even the actions within pages if event tracking is set up (like playing a video or clicking a download link).
What Does Clickstream Analysis Reveal? At a high level, it reveals the common pathways and behaviors of your visitors. Some key insights you can get from clickstream analysis:
-
Popular Paths and Content: You can identify the most common journey users take. For instance, you might find that a large segment of users land on your homepage, then go to the “Pricing” page, and then to the “Contact Us” page – indicating a typical consideration path. Or an e-commerce site might see that many users go from a product page to the size guide and then to reviews before adding to cart. Knowing these popular paths helps you ensure those transitions are smooth (and maybe optimize pages that are key stepping stones).
-
Drop-Off Points: Clickstream/funnel analysis highlights where users leave the site or back out of a process. For example, a checkout funnel might show that 60% of users who start checkout drop off at the shipping information step. That’s a glaring sign of friction on that step (perhaps shipping costs or complexity). Identifying the exact steps where you lose people is the first step in fixing conversion leaks.
-
Entry and Exit Pages: Knowing which pages are the most common entry points (landing pages) and which are common exit points is important. If a certain page has an unusually high exit rate (people often leave after viewing it), you might investigate why – maybe the page isn’t giving them a clear next action. Alternatively, it might be fine if it’s a “thank you” page or a one-and-done blog article. Context matters, but this info tells you where users commonly drop off your site experience.
-
Segmentation of Traffic Behavior: Clickstream data can be segmented by source or user type to compare behaviors. For example, you might compare the navigation paths of users from Facebook ads versus organic search visitors. Perhaps organic visitors browse multiple blog posts then leave, while ad visitors more often hit the sign-up page. This could inform how you tailor landing pages or content to different audience segments. It can also be segmented by new vs returning visitors, geography, etc., to see if different groups use the site differently.
-
Looping or Dead-End Paths: Sometimes analysis might show that users loop around (e.g., go from Page A to B, then back to A – which could indicate they didn’t find what they wanted on B) or that many users end their journey on a certain informational page without converting. These patterns hint at points of confusion or unmet needs. Maybe Page B needs clearer info so people don’t bounce back, or the informational page needs a stronger call-to-action to continue the journey.
-
Multi-page Engagement: You also learn how engaged users are in terms of depth – e.g., what percentage of users visit more than one page, or how many pages on average a user views per session. This is a fundamental measure of the site’s stickiness and content relevance.
Overall, clickstream analysis gives you the macro-level view of user behavior flows. It’s the bird’s-eye perspective complementing the ground-level details from heatmaps/recordings. For marketers, this is crucial for understanding the broader user journey and conversion pipeline.
Why Use Clickstream Analysis – Marketing Applications: Clickstream data is often considered the bread and butter of digital analytics. It directly informs a lot of marketing strategy decisions:
-
Optimize Conversion Funnels: Marketers rely on funnel analysis (a form of clickstream analysis) to improve conversions. By examining each step of a funnel (say: Landing Page -> Product Page -> Add to Cart -> Checkout -> Thank You), you can see where the biggest drop-offs occur. If you find, for example, that only 50% of users who add to cart actually proceed to checkout, that’s a sign to investigate and optimize the transition between those steps (maybe the cart page isn’t prompting checkout clearly, or users use the cart as a wish-list). By systematically removing obstacles at each stage (simplifying forms, adding trust signals, etc.), you can increase the percentage that make it through – directly boosting conversion rate. This is a continuous process in marketing optimization and clickstream data is the core diagnostic tool for it.
-
Inform Content and Navigation Strategy: Clickstream analysis shows which pages users find and in what order, which can inform site structure and content strategy. For instance, if you notice that very few people who visit your blog ever make it to your product pages (perhaps the paths don’t naturally lead there), you might decide to incorporate more internal links or call-to-actions within blog content. Or if one content page surprisingly leads many users to another (say a blog post that drives people to view your case studies page), that’s useful – it means that blog topic is attracting visitors who are interested enough to explore your offerings, so maybe produce more content like that. Essentially, you learn what pathways lead to engagement or conversion and can double down on those. Conversely, if some landing pages have high traffic but those users rarely convert or go deeper, you know to either improve those pages or adjust your acquisition strategy for that traffic.
-
Personalization and Targeting: A more advanced use of clickstream data is to segment users by their on-site behavior for personalization. For example, you might use click paths to identify users interested in a particular category of product (because they navigated through those pages) and then retarget them or personalize the next site visit with relevant content. Clickstream analysis can reveal distinct behavior patterns (like a segment of users who always search the site immediately versus those who browse via menus). Marketers can tailor experiences to these patterns – e.g., ensure the search function is prominent and effective for the search-happy segment. As another example, Netflix uses extensive clickstream data to optimize content recommendations and personalize the user experience – by analyzing what shows people click on or skip, they refine what to display next. This level of data-driven personalization drives retention and engagement, which is essentially a marketing outcome (keeping users happy and subscribed). Even if you’re not Netflix, the principle applies: understanding user navigation paths can help you present more relevant content or offers, thereby improving conversion or retention. As one source notes, segmenting users based on clickstream data allows marketers to deliver targeted content and offers that resonate with specific audiences, ultimately driving higher conversion rates.
-
Campaign and Channel Analysis: Clickstream data is very useful for analyzing the performance of marketing channels. You can track not just that, say, 1000 users came from a Google Ads campaign, but also what they did after arriving. Maybe users from Campaign A mostly bounce after one page, whereas users from Campaign B browse multiple pages and sign up for a newsletter. This insight might tell you that the landing page for Campaign A needs improvement or that Campaign B is targeting a more qualified audience. By examining how different source segments move through the site (their click paths and conversion outcomes), you can refine marketing tactics – allocate budget to the sources that lead to deeper engagement, and fix or drop the ones that don’t.
-
Benchmarking and Goal Tracking: Marketers set goals (conversions, sign-ups, etc.), and clickstream analytics is how we measure progress toward those goals on-site. Tools like Google Analytics allow you to set up Goals (e.g., a form completion) and then analyze paths leading to those goals or the conversion rate through defined funnels. This helps quantify how changes in your marketing campaigns or website affect user behavior flows. For example, after redesigning your homepage, you can check the Users Flow report to see if more people are clicking through to key pages (hopefully an improvement). Or after starting a new content marketing initiative, see if the click paths from those blog entries eventually lead to product or signup pages. In short, clickstream analysis is foundational for data-driven marketing – it provides the evidence of user behavior that either validates or challenges your strategies.
Are Clickstream Analytics Worth It? In nearly all cases, yes – basic clickstream analysis is essential for any data-informed marketing effort. The good news is that clickstream tracking is widely available at low or no cost (e.g., Google Analytics is free for standard use), so the question is less about financial investment and more about time/effort investment. Interpreting clickstream data does require analytical effort, but it’s a cornerstone of understanding your digital audience.
For any website aiming to achieve something (sales, leads, engagement), not analyzing click paths would be like flying blind. Even a simple review of your top entry pages, top exit pages, and most common user flows can yield actionable insights. For example, if you see a lot of people exiting on a particular informational page, you might decide to add a call-to-action there to keep them in the funnel. Or if you find that almost all users who convert have one page in common (like they all visit the “Features” page at some point), you’d ensure that page is prominent and well-optimized. These are relatively straightforward findings that come directly from clickstream analysis.
There are varying levels of depth to clickstream analysis: using an out-of-the-box tool like Google Analytics or Microsoft Clarity gives you standard reports and is absolutely worth doing for marketers of all levels. For larger organizations with more advanced needs, investing in enterprise analytics (like Adobe Analytics, or building a custom Big Data approach) can be worth it – these allow more customization, longer data retention, and cross-channel data integration, but they come with significant costs and require analytics expertise. For most marketing teams, starting with free tools and maybe upgrading as needed (Google Analytics 4, for instance, offers quite sophisticated pathing and funnel exploration now) will cover the bases. Essentially, clickstream analysis is the cost of entry for understanding user behavior: it’s usually not expensive to implement, and the insight-to-effort ratio is high. Marketers should absolutely leverage it to ensure their strategies are grounded in real user navigation patterns. In combination with heatmaps and session replays, you get both the “forest” (overall flows) and the “trees” (specific behaviors) view of your users, which together provide a comprehensive understanding for decision-making.
Comparing Tools for Heatmaps, Recordings, and Analytics
There are many tools available to collect heatmaps, session replays, and clickstream analytics. They range from free services to enterprise platforms. Below, we’ll cover a range of popular options – both free and paid – and compare their core features, pricing models, and ideal use cases. The tools are grouped into two categories: Behavior Analytics Tools (Heatmaps & Session Recordings) and Web Analytics Tools (Clickstream analysis).
Heatmap & Session Replay Tools Comparison
These tools focus on visualizing user behavior (clicks, scrolls, etc.) and often include session recording capabilities. Marketers typically use them for qualitative insights and UX feedback.
| Tool | Key Features | Free Plan? (Limits) | Notable Strengths / Use Case | Pricing (Paid Plans) | Integration/Notes |
|---|---|---|---|---|---|
| Hotjar | Heatmaps (click, scroll, move), Session Recordings, Feedback Polls & Surveys, Conversion Funnels (basic) | Yes – Free forever plan (collects ~35 sessions/day for recordings); Heatmaps on limited pageviews | Beginner-friendly, all-in-one for UX & CRO. Great for marketers who want a quick, code-free setup to see behavior and also gather on-page feedback. Hotjar excels in ease of use and has extra features like on-site surveys and incoming feedback widgets (useful for combining quantitative and qualitative insight). | Paid plans from ~$39/month (Business plans scale by number of daily sessions/pageviews tracked). Pricing is relatively affordable for SMBs, and you can choose tiers based on traffic volume. | Easy installation (script or Google Tag Manager). Recently introduced integrations with Slack, Jira, Trello, etc., for team collaboration. Hotjar is very privacy-conscious (GDPR compliant by design) and automatically suppresses keystroke data. No built-in third-party integrations beyond those collab tools, but it connects with products via API and supports Segment, Mixpanel, etc. Good for CRO, UX improvements on websites, not for in-app mobile analytics. |
| Crazy Egg | Heatmaps (click, scroll), Confetti click segmentation, Scrollmaps, Overlay (click details), Session Recordings, A/B Testing (basic editor) | No free plan – (Free trial available). | Robust heatmap analytics for marketers who want more segmentation. Crazy Egg’s unique Confetti report is a standout: it shows individual clicks color-coded by source, device, etc., letting you filter click data by 22 dimensions for context (e.g., distinguish clicks by referral source or by new vs returning users). This helps answer who is clicking, not just where. Great for intermediate/advanced marketers and CRO professionals who need deeper analysis than basic heatmaps. Also offers built-in A/B test tool for simple design changes. | Paid plans start at $24/month (Basic) for ~30k pageviews/month. Higher plans (Standard $49, Plus $99, Pro $249/mo) increase pageview and recording quotas and add more domains. All plans include full feature set (heatmaps, recordings, etc.), scaling mainly by traffic volume. | Provides many integrations out-of-the-box, e.g. CMS and marketing tools like WordPress, Shopify, HubSpot, Magento, and also testing tools like Optimizely. Easy to add via GTM as well. Crazy Egg is also GDPR-compliant (doesn’t track personal info by default). Notably, it doesn’t track individual user identities – focusing on aggregate behavior. Good choice when you want detailed click analysis and lightweight A/B testing in one. No built-in feedback surveys (integrates with SurveyMonkey for that). |
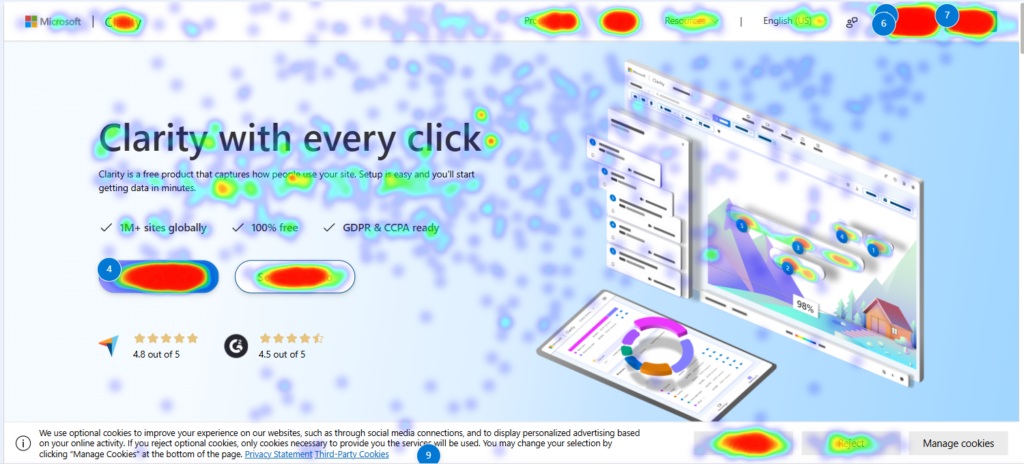
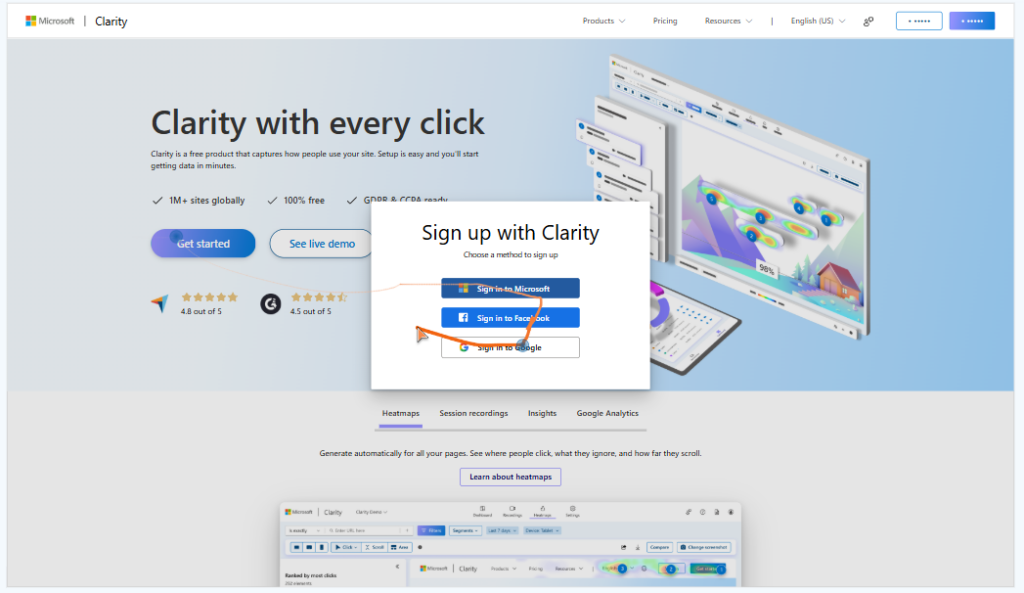
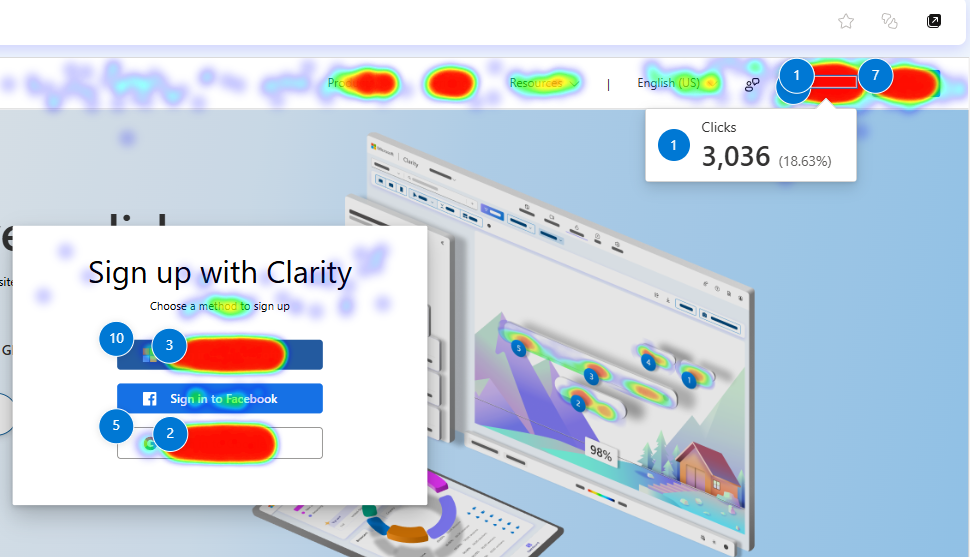
| Microsoft Clarity | Heatmaps (click, scroll, area), Session Recordings, Analytics Dashboard (basic metrics like click counts, referrers), ML insights (rage click detection, dead click highlights) | Yes – 100% free (no paid tier). Clarity offers unlimited heatmaps and recordings for unlimited sites. There is effectively no cap on session count or traffic (up to very high limits per day). | Completely free solution ideal for budget-conscious teams and high-traffic sites that want to capture everything. Clarity automatically surfaces interesting segments (e.g., “rage clicks” – where a user clicks rapidly in frustration – are flagged in the dashboard). It also doesn’t sample data, so it records all user sessions by default, providing a very complete dataset. Use Clarity if you want massive scale behavior tracking at no cost, or as a complement to Google Analytics for qualitative insights. | Free forever (Microsoft’s offering with no direct monetization; they may use aggregated data for improving their services). Because it’s free, there’s no direct support channel beyond documentation, and data retention is currently up to 12 months. | Easy to integrate (one script or through Google Tag Manager). It integrates with Google Analytics – you can pass a Clarity session ID into GA and vice versa for combined analysis (requires some setup). Data is stored on Microsoft’s servers (consider privacy – Clarity’s terms allow Microsoft to use your data for their own purposes in aggregated form). Note: Clarity cannot be used on sites with highly sensitive data (e.g., healthcare, financial, government sites) due to its terms. It’s an excellent starter tool for heatmaps & replays with surprising depth (filters for device, browser, etc.), though it lacks extras like surveys or form analysis. |
| FullStory | Session Replay (high-fidelity, with console logs and dev tools), Event Analytics (autocaptured clicks, page views, etc.), Funnels & Segmentation, Retroactive Heatmaps (FullStory can generate heatmaps on any UI element after the fact), Error detection, and robust search (find sessions where users did X). | Yes – Free plan available (up to a certain number of sessions/month, with limited retention). For example, FullStory Free offers a base level of sessions (maybe ~1k sessions/month) for small sites to try out. | FullStory is a premium, enterprise-grade platform – best suited for product analytics, support, and UX teams that need deep behavioral data and diagnostic tools. For marketers, it’s powerful if you need to correlate user behavior with outcomes in detail. FullStory not only records sessions but also indexes every interaction (clicks, page transitions, form inputs) so you can search and segment with precision – e.g., “show sessions where user clicked the signup button but did not complete purchase” and then watch those. It’s great for troubleshooting specific customer issues (it captures console errors, allowing devs to see why something broke) and for advanced funnel analysis that blends quantitative and qualitative. FullStory also provides aggregated conversion funnels, user retention analytics, and even some machine learning insights. It’s the best option when you require comprehensive behavior analytics with technical depth – often used by larger companies that have a dedicated conversion optimization or product analytics team. | Expensive for high usage. FullStory’s paid plans (Business, Advanced, Enterprise) are custom-priced based on session volume and features; rough estimate: Business plans can start a few hundred USD/month. It’s noted that FullStory subscriptions can exceed $350/month for advanced tiers. The pricing scales with number of sessions recorded and retention period (how long data is stored). Enterprise plans (with longest retention and all features) can run into thousands per month for very high traffic sites. | Integrates with many tools, especially in support and product realms: e.g., integrates with Intercom, Zendesk (to link replays to support tickets), with CRM like Salesforce, with analytics like Segment and Mixpanel, and with collaboration tools (Jira, Slack alerts, etc.). One thing to note: by default FullStory can track identified users (tying recordings to user profiles), which means you must ensure GDPR/CCPA compliance by informing users or turning off that feature. FullStory is known for “autocapture” – it logs everything without you defining events upfront, making it very powerful out-of-the-box for exploration. Choose FullStory if you need a professional-grade session replay with full analytics suite and are willing to invest accordingly. For a marketer at a smaller company, this might be overkill, but for a data-driven organization, it can unify marketing, product, and support insights in one platform. |
| Mouseflow | Heatmaps (click, scroll, attention, movement), Session Recordings, Form Analytics (identifies where users drop out in forms), Funnels, Feedback surveys. | Yes – Free plan (up to 500 recordings/month, 1 heatmap, 1 funnel, etc.). | A strong alternative to Hotjar with more focus on form analytics and funnel tracking. Mouseflow automatically detects form abandonment and provides insights like which fields cause hesitation. It also has an “attention heatmap” (showing where users spend time on the page). Good for mid-sized businesses who want a balance of qualitative and quantitative – Mouseflow’s funnel tool lets you see where users drop off in a multi-step path and then watch recordings of those drop-offs, which is great for diagnosing conversion issues. It’s often used for e-commerce and form-heavy sites. | Paid plans start around $24/month (for 5k recordings with limited retention) and scale up by number of recordings and sites. For example, a Medium plan (~$79/mo) offers 10k recordings and more heatmaps, etc. Pricing is in tiers (Solo, Starter, Growth, etc.). | Integrates with various platforms: e.g., CMS plugins (WordPress, Shopify), and also offers an API. Like other modern tools, it is GDPR compliant with data anonymization options. If comparing, Mouseflow is similar to Hotjar in many respects, but often praised for its form analytics and filtering capabilities. It might capture slightly more detail by default (like frustration clicks) and allows filtering recordings by traffic source, device, etc. A good all-in-one if Hotjar’s free limits are restrictive and you need additional funnel insight without going to enterprise level. |
| Lucky Orange | Heatmaps, Recordings, Live Chat, Form Analytics, Polls. | Yes – Free trial (usually 7 days; no permanent free tier after trial). Often runs ~$10/month entry. | An affordable option for small businesses, Lucky Orange provides a broad suite: you get heatmaps and session replays plus live chat and chat transcripts, which is unique (blending analytics with customer support). It also has conversion funnels and form drop-off reports. It’s useful for small ecommerce or lead-gen sites that want multiple tools in one (behavior analytics + chat + feedback). The interface is not as polished as Hotjar, but it’s budget-friendly. | Paid plans from $9 or $12/month (for low traffic sites), scaling up by number of pageviews/recordings. For instance, $20–$50/month plans cover moderate traffic sites with tens of thousands of pageviews. Still cheaper than most Hotjar business plans for similar volume. | Integrations include popular platforms (Shopify, WordPress, Google Tag Manager, etc.). Lucky Orange is often touted for real-time analytics – you can watch visitors live and even initiate a chat if you see them stuck (hence the name “Lucky Orange” implying you can “lucky” catch and help visitors). This real-time aspect is a differentiator. It may not have as advanced filtering or segmentation as Hotjar/Mouseflow, but for a small marketing team, it’s a cost-effective toolkit to improve website UX and engage users directly. |
Other notable tools: Inspectlet (similar to Hotjar/Lucky Orange, with a free tier for 100 sessions – good for basic recording needs), Contentsquare (CX Insights) – an enterprise platform combining heatmaps, zone-based analytics, and rich UX analytics (great for large e-commerce, but very expensive). Quantum Metric and Decibel Insight are other enterprise players focusing on digital experience analytics (with features like session scoring, huge data volume handling). For open-source enthusiasts, PostHog and OpenReplay offer self-hosted session recording solutions, though with more setup effort. Finally, VWO (Visual Website Optimizer) and Optimizely are primarily A/B testing platforms that have added session replay/heatmap modules – useful if your focus is testing and you want an integrated solution. The choice of tool will depend on your traffic scale, budget, and specific needs (e.g., do you need form analytics? surveys? or just raw recordings?).
Web Analytics (Clickstream) Tools Comparison
These tools are centered on tracking aggregate user statistics, events, and paths. They are the go-to for quantitative analysis of traffic sources, user flows, and conversion metrics. Most marketers will use at least one of these for baseline website analytics, and possibly more for advanced product or user journey analysis.
| Tool | Key Features | Cost (Tier) | Ideal Use Case / Strengths | Integration & Notes |
|---|---|---|---|---|
| Google Analytics (GA) | Pageview tracking, traffic source attribution, conversion goals, funnel visualization (GA4: custom funnels, path analysis), user segmentation, e-commerce tracking, real-time stats. GA4 also supports event tracking (clicks, downloads, etc.) and basic user journey analysis with its Explorations. | Free (Standard) – GA is free for most users with high limits (GA4 allows up to 10M events per month per property). Paid (GA 360) – Enterprise plan starting ~$150k/year for extra features, higher data limits, and support (generally only for very large organizations). | Universal choice for marketers of all types. Google Analytics is the most widely used analytics platform, suitable for everything from small blogs to large websites. For marketers, GA provides comprehensive insight into who your visitors are, how they found you, and what they do on your site. Its strength is in clickstream analysis and reporting: you can see user flows, top landing pages, drop-off points, and conversion rates all in one place. GA4 (the latest version) emphasizes event-driven data, enabling more flexible analysis of user behavior across websites and apps. It’s particularly strong for analyzing marketing campaign performance (thanks to integration with Google Ads and multi-channel funnels). Use GA to get all your baseline metrics: sessions, bounce rate, session duration, pages per session, etc., and to set up goals (like form submissions or purchases) and measure conversion funnels quantitatively. | GA integrates deeply with the Google marketing ecosystem: Google Ads, Search Console, Data Studio (Looker Studio) for reporting, and more. Many third-party tools and CMSs have one-click integration or plugins for GA. Note: GA4 has a learning curve (different interface from classic UA), but it adds powerful pathing tools (e.g., a visual path exploration report to see common paths through the site). Privacy compliance is important – GA is under scrutiny in some regions (due to data transfer issues), but Google is evolving the platform to address this. Overall, GA remains the go-to clickstream analysis tool for most marketers because it’s free, powerful, and constantly improving. Just be sure to configure it correctly (defining events, conversions, etc.) to get the most out of it. |
| Adobe Analytics | Customizable tracking (page views, events), advanced segment creation, real-time reports, marketing attribution modeling, e-commerce reporting, pathing analysis, calculated metrics. Highly flexible schema. | Paid (Enterprise) – Adobe Analytics (part of Adobe Experience Cloud) is a premium product, typically costing in the tens of thousands of dollars per year and up, depending on traffic volume and modules. Pricing is custom-quoted. | Adobe Analytics is an enterprise-grade web analytics solution, often chosen by large companies that need very customized tracking and deep analysis. It’s excellent for heavy-duty analysis across multiple channels, with strong capabilities in pathing and fallout (funnel) analysis, customer segmentation, and integration with other Adobe marketing tools (Target, Campaign, etc.). Ideal if you have a dedicated analytics team that wants to tailor every detail – you can set up custom metrics and dimensions, and do very granular segmentation. Marketers at enterprise e-commerce or media organizations often use Adobe for its ability to handle massive data volumes and complex visitor segmentation (e.g., creating segments of users who did A but not B, then seeing all their journeys). | Integrates with the Adobe Experience Cloud suite (Target for personalization/A-B testing, Adobe Campaign for email, etc.) and has data feeds to import/export data. Non-Adobe integrations are less automatic than GA’s, but Adobe offers APIs and data connectors (for CRMs, etc.). Adobe’s strength is also its real-time processing and the Analysis Workspace interface which analysts love for deep dives. Downsides: cost and complexity – it requires significant expertise to set up and maintain (often a full-time analyst or consulting partner). For marketing teams without enterprise needs, GA or others will suffice, but for those needing enterprise-level custom clickstream analysis at scale, Adobe is a top choice. |
| Matomo (formerly Piwik) | Web analytics similar to GA (pageviews, campaigns, goals, funnels) but self-hosted or cloud-hosted option. Provides click path analysis, heatmap and session recording add-ons (at extra cost), form analytics add-on, and strong privacy controls. | Free (Open-source self-hosted) – the core Matomo software can be installed on your own server for free. Cloud Hosted – starts around $23/month for up to 50k pageviews, scaling upward (e.g., $119/mo for 500k pageviews, etc.). Additional premium features (like heatmaps, session logs) can be purchased a la carte or via higher-tier plans. | Matomo is ideal for organizations that want full control of their analytics data (for privacy, compliance, or flexibility reasons) or those who prefer not to rely on Google. It’s often used by government sites or EU companies keen on GDPR compliance, since data can be kept on your own servers. In terms of functionality, Matomo covers most standard analytics needs: tracking visits, user paths, goals, e-commerce, etc. It even has some features GA doesn’t readily offer, like tracking individual sessions and a form analytics module. For marketers, using Matomo feels a lot like using a classic version of Google Analytics, with the benefit that you own the data. It’s a great choice if you need analytics without data sharing (with third parties) or if you want to extend analytics with custom plugins (Matomo’s marketplace has plugins for media analytics, funnel, heatmaps, etc.). | Integrations: Matomo can import logs directly from web servers, and it has integrations for CMSs (WordPress has a popular Matomo plugin, for example). It can also integrate with Tag Managers or accept data via an API. Note that to get features like heatmaps or session replays in Matomo, you’d either self-host the plugin (premium purchase) or subscribe to a higher cloud tier. Those features are not as out-of-the-box as in dedicated tools. But from a clickstream standpoint, Matomo is quite robust and a solid alternative to GA, especially valued for privacy – no data sent to third parties. The downside is you are responsible for maintenance if self-hosting (ensuring the tracking code is updated, handling database size), and the interface might not be as slick or as continuously evolving as GA4. |
| Mixpanel / Amplitude | Event-based product analytics platforms. They track user actions (events) rather than just pageviews, supporting detailed funnel analysis, cohort analysis, retention, and user lifecycle tracking. Great for analyzing user behavior in web/apps over time and across sessions. | Mixpanel: Free up to 100k monthly tracked users (with certain data limits). Paid plans from ~$25/month and up based on data volume and features. Amplitude: Free up to a certain event count (e.g., 10M events/year). Paid plans for higher volumes and advanced features (pricing custom or tiered). | These tools are geared toward product analytics but are very useful for marketing in contexts like SaaS, apps, or any scenario where you want to analyze specific user actions and properties beyond basic page paths. Mixpanel and Amplitude allow you to define events like “Signed Up”, “Used Feature X”, “Upgraded Plan” and then do funnel analysis (e.g., of those who signed up, what percentage performed Feature X). For marketing, this is valuable for understanding activation and engagement beyond the website brochure pages – it bridges into how users behave after becoming leads or customers. They shine in cohort analysis: for instance, you can see retention curves (do users who come from campaign A stick around longer or use the product more than those from campaign B?). They also handle cross-platform data (web + mobile app) well. Choose Mixpanel/Amplitude if you need to analyze the entire user journey and lifecycle, not just site navigation – for example, a product-led growth team would use these to see how marketing acquisition translates into long-term product usage. | Integration: Both have extensive integration options (Segment, Zapier, APIs) and can import data from various sources. They also export data to data warehouses for BI. In a marketing stack, you might use GA for website traffic and Mixpanel/Amplitude for in-app behavior – or send GA data into these for a unified view. The learning curve exists: event-based thinking is different from pageview analytics, so you define a tracking plan for meaningful actions. But the reward is flexible analysis: you can slice and dice by user properties (say, “show funnel only for users from campaign X” or “retention of users in country Y”). These tools are worth it if your marketing success is tied closely to product usage or if you need granular funnel analytics that web analytics can’t provide easily. If your scope is just website visits to lead form, standard web analytics may be enough. |
Other tools: There are many specialized or emerging analytics tools. Segment (now Twilio Segment) isn’t an analytics UI, but a customer data platform that routes your clickstream data to various tools – useful if you want to send the same data to multiple places (GA, Mixpanel, etc.) without double coding your site. Heap Analytics offers event auto-capture (like FullStory, but for analytics charts rather than replays) – it automatically tracks clicks and form submissions and lets you retroactively define events. It’s great for teams who don’t want to plan tracking upfront, though it can be pricey beyond the free tier. Simple Analytics and Plausible are lightweight, privacy-first web analytics ideal for simple use cases – they give you core web stats in a clean way (no personal data, no cookies in some cases), good for content sites or campaigns where you just need basic insights without user-level drilling. Finally, for truly advanced needs, companies might use BigQuery or Snowflake to store raw clickstream data and analyze it via SQL or tools like Tableau; this is only worth it if you have data engineering resources and huge data volumes, or want to merge website data with other business data for holistic analysis.
Maximizing ROI: When to Use Each Method
Each of these methods – heatmaps, session recordings, and clickstream analytics – has its own strengths. Deciding where to focus your time and budget depends on your specific marketing objectives and the type of site or product you manage. Here are some guidelines on when each method is most worthwhile, and how they complement each other:
-
Use Heatmaps for Page-Specific UX and Content Insights: Heatmaps are best applied when you want to optimize the layout and content of key pages. If you’re running a landing page campaign (for example, a PPC ad driving traffic to a signup page), a heatmap can quickly show if visitors are seeing and clicking the call-to-action or if they’re getting distracted. For e-commerce product pages, a scroll heatmap tells you if customers see the product details and reviews or bail too early – informing whether you need to rearrange content. Heatmaps provide immediate visual answers to “Are users noticing what we want them to notice?” So they’re worth it any time the placement and emphasis of on-page elements could impact conversion. The investment (time or money) is usually low relative to the benefit: even free tools can generate heatmaps that yield a clear action (e.g., move a button, cut irrelevant content). On content-heavy sites or blogs, heatmaps help identify engaging content sections versus those routinely skipped – guiding your content strategy. In summary, for marketers focused on conversion rate optimization or improving engagement on important pages, heatmaps are a high-ROI tool, often revealing quick wins.
-
Use Session Recordings for Diagnosing Funnel Drop-offs and Usability Problems: Session replays shine when you need to understand why users aren’t converting or where they struggle. They are especially valuable in multi-step processes – for instance, watching recordings of users who started a checkout but didn’t finish can uncover UX issues that analytics alone can’t (an confusing field, an unresponsive button, etc.). If you run an online store or a SaaS signup/onboarding flow, session recordings are worth the time to identify and fix pain points that directly affect revenue. They are also useful for high-value flows: say you notice via analytics that your account upgrade page has a high drop-off – watching a few session replays there might show that users get cold feet when confronted with pricing, or perhaps a form isn’t working properly on mobile. Session recordings do require more time investment (because you have to watch them), so they’re most worth it when there’s a specific problem to solve or during key redesigns. One efficient approach is to use recordings in a targeted way: for example, filter and watch sessions for a specific segment (users from a particular campaign, or users who encountered an error). This way, you answer critical questions without boiling the ocean. Overall, when conversion or user journey issues are at stake – and especially if the funnel is long or critical – session replays provide ROI by uncovering the root causes of user friction, which once fixed, can significantly boost your outcomes (remember the examples of 20%+ conversion lifts following issues identified in recordings).
-
Use Clickstream Analysis continuously for Strategic Decisions: Basic analytics is not optional – it’s the foundational layer that runs all the time in the background. Every marketing team should leverage clickstream data to track KPIs and understand user flows. It’s most worthwhile for big-picture optimization and trend spotting. For instance, clickstream data will tell you if mobile users consistently drop off more than desktop users at a certain step – indicating maybe a mobile usability problem. It will show if a certain content route (like users reading the blog then going to pricing) converts better than another – informing where to focus your content efforts. Because tools like Google Analytics are free and ubiquitous, the main investment is the time to analyze reports and set up tracking for your goals. This is an ongoing need: as you launch new campaigns or site changes, you rely on clickstream metrics to gauge success. For different types of marketing use cases: if you’re doing SEO/content marketing, clickstream data (e.g., user flow through content, bounce rates) tells you how engaged organic visitors are and how you might funnel them to conversion pages. If you’re in paid acquisition, you’ll watch click paths and conversion by campaign to optimize spend. For product marketers or growth teams, deeper clickstream/product analytics (Mixpanel, etc.) are worth it to connect pre-conversion behavior to post-conversion retention (ensuring you acquire users who stick around). In short, clickstream analysis is always worth the effort because it’s the compass for your marketing strategy – it reveals what users do en masse, which informs everything from site navigation improvements to campaign targeting. The key is to ensure you’re actually looking at the data regularly and tying it to actions (e.g., noticing a high drop-off page and then doing something about it).
Importantly, these methods are complementary. A common scenario is: you use clickstream analytics to spot where problems or opportunities exist (e.g., a checkout step with high abandonment, or a page that users rarely proceed beyond). Then you deploy heatmaps or session recordings to drill into why that’s happening (maybe the heatmap shows the CTA is unseen, or recordings show an error). Then you make changes and use analytics again to measure improvement. This iterative cycle ensures you’re making data-driven decisions and continuously improving the user experience, which is the crux of effective marketing optimization.
Financially, many teams start with free tools (Google Analytics, Clarity, a free Hotjar plan) – yielding plenty of insight with zero cost. As the insights prove their value (e.g., you make changes that improve conversion), it often makes sense to invest in paid plans of tools for more data or advanced features, because you’ve demonstrated ROI. For example, if a $50/month heatmap tool helps you increase monthly sales by $5,000, it’s a no-brainer to continue or even upgrade for more insights. On the other hand, if you have a very low-traffic site or a very simple one-page website, you might not need fancy tools immediately – basic analytics and some qualitative feedback could suffice until you grow.
Summary: Use heatmaps when you need a quick visual read on page effectiveness and to guide layout/content tweaks; use session recordings when you need to empathetically see the user’s experience and diagnose issues in detail; and use clickstream analysis continuously to monitor and steer your overall marketing performance. The most successful marketers blend all three: high-level analytics to know what’s happening, and heatmaps/replays to understand why, then act on both levels.
Best Practices and Common Pitfalls
To get the most out of heatmaps, session recordings, and clickstream data, keep these best practices in mind and avoid common mistakes that can mislead your analysis:
-
Define Clear Goals & KPIs First: Before diving into these tools, clarify what you’re trying to improve or investigate. Are you aiming to increase sign-ups on a landing page? Improve engagement with a feature? Setting a goal focuses your analysis. For example, if your goal is to boost newsletter signups, you might specifically examine heatmaps on blog pages to see if the signup form is noticed, or use clickstream funnels to see how many people go from blog to signup. Clear objectives prevent you from drowning in data and help you measure success after change.
-
Segment Your Analysis: Not all users behave the same. A very common mistake is to analyze aggregate heatmap or journey data without segmentation. Break down data by relevant segments such as device (desktop vs mobile), new vs returning visitors, traffic source, or customer type. For instance, a heatmap for desktop users might look very different from mobile users (who have to scroll more due to smaller screens). If you lump them together, you might miss that mobile users never see your CTA because it’s too low. Similarly, session recordings for first-time visitors might reveal different confusion points than those for logged-in customers. By segmenting, you get more tailored insights – and you can implement more targeted fixes (like a mobile-specific layout change). Most tools allow filtering or segmenting; use those features to avoid one-size-fits-all conclusions.
-
Consider Context – Don’t Assume, Validate: It’s easy to misinterpret behavior data if you don’t consider the user’s context and intent. For example, don’t automatically assume that a click means interest – sometimes clicks mean confusion. If a lot of users click an element that isn’t actually a link, it could mean they expected it to do something (frustration). Or if they don’t click a button, it might not mean they’re uninterested – maybe they didn’t realize it was clickable or it wasn’t visible enough. Always formulate multiple hypotheses for what could be causing a behavior. Then use other data or methods to validate. For instance, you see on a heatmap that users aren’t clicking a signup button – your hypotheses could be: (a) they don’t want to sign up, (b) the button is hard to notice, or (c) they have already signed up and that’s a returning user pattern. You might then run an A/B test with a more prominent button to see if clicks increase, or gather user feedback via a survey to ask if anything prevented them from signing up. Likewise, if scroll data shows users stop halfway down the page, consider why: did they get what they needed by halfway (positive outcome), or did they lose interest (negative)? Combine qualitative methods (surveys, user interviews) or additional analytics to interpret the “why” behind the “what” that heatmaps/analytics show you. Session recordings can also provide context that pure heatmap data lacks – for example, a scroll heatmap can’t tell if a user who stopped scrolling did so because they found the info they wanted up top, whereas a session recording might show that after stopping, the user happily clicked the “Add to Cart” (mission accomplished).
-
Don’t Ignore Mobile Behavior: In today’s traffic mix, mobile visitors are often a huge portion. A mistake is focusing analysis only on desktop heatmaps or recordings. Mobile users interact differently – tap instead of click, shorter sessions, different screen real estate, etc. Make sure your tools are capturing mobile sessions and generate separate heatmaps for mobile views. You might discover, for instance, that on mobile, an element appears far down or a pop-up covers the screen, whereas on desktop it was fine. Some heatmap tools automatically provide device-specific views, but if not, segment by user agent. Also consider tablet if relevant. Bottom line: optimize for the mobile experience by explicitly analyzing it; otherwise you could be solving a desktop-only problem while losing conversions on phones.
-
Combine Methods for a Complete Picture: Each method has blind spots. Heatmaps show where, but not why. Session recordings show individual stories, but one person’s struggle might not represent the majority. Clickstream analytics show overall patterns, but can’t reveal subtle usability issues. The best practice is to use these in tandem. For example, use clickstream data to identify a problem area (high drop-off step), use heatmaps to see if on that page something obvious stands out (maybe no one clicks the continue button because it’s below the fold), and watch session replays to witness the user’s experience on that step (perhaps a loading spinner stuck, or they scroll twice and give up). This way, you cross-validate insights. If all signs point to the same conclusion, you can be confident in it. If they conflict, dig deeper. Also, if you implement a change, use your analytics to see if it improved the metrics, and consider running an A/B test for confirmation. A key pitfall is relying solely on one tool’s data in isolation – that can lead to misdirected efforts. Each tool should inform the others.
-
Don’t Overreact to Small Data or Novelty: Heatmaps and recordings can be compelling (they’re visual and sometimes even entertaining to watch), but be cautious about reacting to a couple of sessions or a day of data. Ensure you have enough sample size to draw conclusions. A common mistake is seeing one user do something strange on a session replay and immediately redesigning for that – only to find it was an outlier case. Similarly, a heatmap “hot spot” is only meaningful if you’ve had a good amount of traffic; if only 10 people visited a page, the heatmap coloring might be misleading. Give it time or gather more sessions to get statistically significant insights. Also, avoid the novelty effect: for example, the first time you run a heatmap, everything might look interesting. Stick to your goals (what are you trying to improve) and don’t get sidetracked by less relevant observations. Make changes based on patterns, not one-offs, and ideally test major changes. This is where combining quantitative measures helps – e.g., if heatmaps suggest an issue and your GA data also shows a high exit rate there, it’s likely real. Overreacting without validation (or “design by one session replay”) can lead to wasted effort or even hurting conversion if you mis-read the data.
-
Iterate and Monitor Continuously: Think of these tools as part of an ongoing optimization loop, not a one-time project. User behavior can change over time (seasonally, or as you attract new audiences, or as you add new features). A common pitfall is doing a round of analysis and fixes, and then assuming the site is “optimized” permanently. In reality, you should revisit heatmaps and funnels regularly, especially after any site changes or new campaigns. For example, if you redesign your homepage, set a reminder to check the new heatmap after a few weeks – are people interacting with the new sections as intended? If you launch a new product feature, watch some session recordings of users trying it out. Also, as you implement improvements, use these tools to verify the effect (did the hot spot move? Did recordings show the frustration is gone?). Many experts recommend integrating behavior analysis into your routine – e.g., watch a couple of session recordings each week, or review monthly heatmaps on key pages. This ongoing approach catches new issues early and continuously informs your marketing tweaks. Remember, consumer expectations evolve, and what was optimal last year might need refining this year. Keep an eye on your data and never assume you’re “done” – continuous improvement is a best practice.
-
Privacy and Ethical Use: While not a data insight per se, it’s a best practice to use these tools responsibly. Ensure that you’re not violating user privacy. Most session replay tools mask sensitive fields by default (like password or credit card inputs). Double-check this, and configure masking for any fields that might capture personal data (names, emails, etc. if not needed). Always have a privacy policy that discloses the use of tracking/recording for analytics. In some jurisdictions, you may need user consent for session recordings. It’s both a legal and ethical consideration – maintain user trust by handling their data respectfully. Avoid the mistake of recording more than you need (e.g., don’t record keystrokes on search fields if not necessary, etc.). Anonymized, aggregated insights are the goal – you’re interested in user behavior patterns, not snooping on individuals. All reputable tools provide compliance features; use them.
-
Don’t Neglect Action: Finally, a “meta” mistake to avoid: collecting tons of data and generating insightful reports, but not actually acting on them. The value of these tools only comes when you implement changes or optimizations based on the findings. It can be overwhelming – sometimes these tools reveal many possible improvements. Prioritize changes that impact your key goals (maybe use the ICE method – Impact, Confidence, Ease – to pick what to do first). Make sure to close the feedback loop: you saw an issue, you fixed it, now did it improve the metrics? Use analytics to confirm and iterate if needed. By continually acting on insights, you’ll foster a data-driven culture and see real results, rather than analysis paralysis.
By adhering to these best practices – and staying wary of the common pitfalls – you’ll ensure that heatmaps, session recordings, and clickstream analytics truly inform and enhance your marketing strategy. When used correctly, these tools provide a window into your customers’ world, helping you create more user-centric and high-converting web experiences. Happy analyzing, and may your conversions ever increase!
Sources:
-
Nielsen Norman Group – Conversion improvements with heatmap analysis linkedin.com
-
LinkedIn (Al Refatul Islam) – Examples of heatmap and clickstream insights linkedin.com
-
Sprig – Common mistakes in heatmap analysis (interpretation, context, segmentation) sprig.comsprig.com
-
Hotjar vs. Clarity – Tool capabilities and limits hotjar.comhotjar.com
-
Crazy Egg – Tool comparison and user fit (Hotjar vs FullStory vs Crazy Egg) crazyegg.com
-
Crazy Egg – Pricing and integration details crazyegg.com
-
Crazy Egg – Confetti click segmentation feature crazyegg.com
-
VWO / ConversionXL – Case study (Bear Mattress heatmap uplift) vwo.com
-
Wudpecker – Case study (session recordings fixing checkout for +20% conversions) wudpecker.io
-
Helio – Clickstream definition and marketing benefits (personalization) helio.app
-
FullStory (Vertice) – FullStory pricing benchmark vertice.one
-
VWO – Session recording definition and benefits (empathy, conversion impact) vwo.com