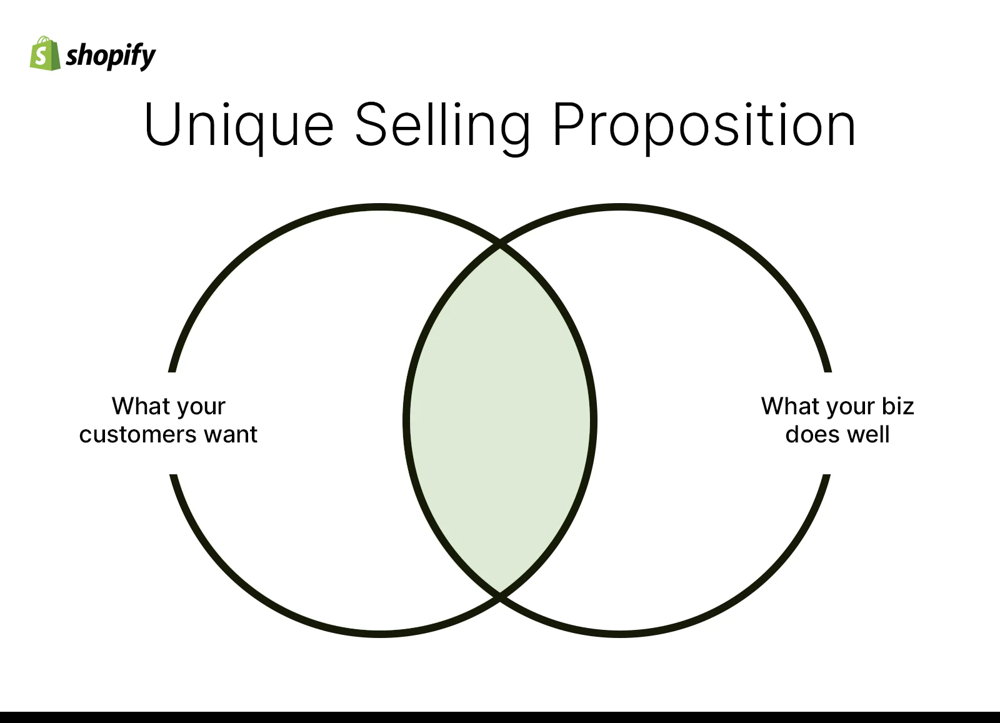
The Unique Selling Proposition sits at the intersection of what your customers want and what your business does best.
This graphic illustrates the USP concept with a simple Venn diagram: one circle represents customer needs, the other represents your company’s strengths, and the shaded overlap is where your unique value lies.