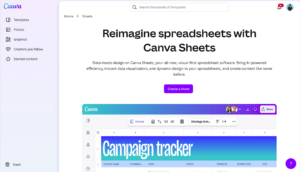
Canva, the global leader in visual communication, has once again redefined the way we work, create, and collaborate. In its latest innovation, Canva introduced Canva Sheets, a powerful addition to its Visual Suite 2.0, designed to revolutionize the traditional spreadsheet experience. Seamlessly blending the functionality of spreadsheets with Canva’s intuitive design tools and artificial intelligence, Canva Sheets sets a new benchmark for how we analyze, present, and communicate data.
What is Canva Sheets?
Canva Sheets is not just another spreadsheet tool—it’s a creative leap forward. Built for modern teams, marketers, educators, content creators, and entrepreneurs, Canva Sheets combines familiar spreadsheet functionality with visually rich design elements and AI-driven features. It empowers users to transform raw data into clear, compelling visuals, insights, and interactive charts without needing advanced technical knowledge.
Rather than simply calculating numbers, the new tool helps you communicate them—with beauty, clarity, and purpose.
Key Features of Canva Sheets
1. Magic Insights
One of the standout features of Canva Sheets is Magic Insights. This AI-powered functionality instantly analyzes data sets to provide summaries, highlight trends, and reveal key takeaways. No more manual number crunching or writing formulas—Magic Insights reads your data and offers context in natural language, helping users make smarter decisions faster.
2. Magic Charts
Creating effective visualizations often requires both design skills and analytical expertise. With Magic Charts, Canva Sheets eliminates the guesswork. Users can select data and instantly generate bar graphs, pie charts, line charts, and animated visuals tailored to their information. The system recommends the best chart type for your data, ensuring clarity and impact in every presentation or report.
3. Magic Write
Canva’s signature AI writing assistant, Magic Write, is embedded within Sheets as well. This feature can autofill missing content, summarize trends, or even generate content such as financial summaries, project updates, or to-do lists based on your data. Magic Write helps users save time while maintaining a polished, professional tone.
4. Smart Templates
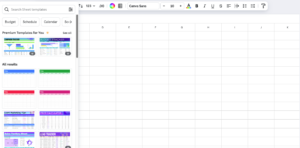
Canva Sheets comes with a wide variety of customizable templates tailored for business reports, marketing analytics, budgets, calendars, content planning, and more. These templates are designed to be visually compelling and fully editable, helping users start faster and stay on-brand.
5. Data Connectors
Unlike traditional spreadsheet programs that require manual uploads or complex integrations, Canva Sheets supports real-time data connections. Users can import data from services like Google Analytics, HubSpot, and other popular platforms. This dynamic linking ensures spreadsheets remain up-to-date, relevant, and actionable.
6. Real-Time Collaboration
Built on Canva’s collaborative backbone, it enables multiple users to edit, comment, and interact with spreadsheets in real-time. Team members can co-create dashboards, brainstorm data strategies, and present findings without switching between platforms.
7. Unified Design Language
Perhaps the most unique aspect of this new tool is that it lives within Canva’s design ecosystem. This means you can effortlessly drag charts from Sheets into presentations, reports, whiteboards, or social media designs while maintaining a cohesive visual identity across all assets.
Who is Canva Sheets For?
Its versatility allows it to cater to a wide range of professional and creative users:
-
Marketers can track KPIs, campaign metrics, and performance dashboards while maintaining brand consistency.
-
Educators can build lesson plans, gradebooks, and student progress trackers with dynamic visuals.
-
Entrepreneurs and small businesses can manage budgets, forecasts, and planning documents more intuitively.
-
Content creators and influencers can analyze audience data, content calendars, and performance reports and turn them into easy-to-share visuals.
Whether you’re a data novice or a spreadsheet pro, Canva Sheets helps you tell stories through your data—not just calculate it.
Canva Sheets Within Visual Suite 2.0
Canva Sheets is part of Canva’s broader Visual Suite 2.0, which includes a powerful collection of tools like:
Canva Code: A simplified coding experience for interactive web content.
Magic Studio at Scale: Batch creation of personalized designs powered by AI.
One Design Workflow: Unified file management across presentations, documents, whiteboards, and now spreadsheets.
This suite is Canva’s response to the growing need for all-in-one workspaces that combine productivity, creativity, and AI automation. By centralizing these capabilities, Canva is positioning itself not just as a design tool—but as a next-generation productivity platform.
Why Canva Sheets Matters
Traditional spreadsheet tools have served businesses for decades, but in a visually driven digital world, raw rows and columns often fall short. Canva Sheets addresses this gap by enabling anyone—from non-technical users to seasoned analysts—to work with data in a more engaging, human-centered way.
The timing couldn’t be better. As data literacy becomes essential across industries, tools like Canva Sheets democratize access and make complex information easier to understand and act upon. Visual storytelling with data is no longer a niche skill—it’s becoming a core business function.
The Business Impact
Since the announcement, Canva has reported record-breaking user engagement. The platform now serves over 230 million monthly active users globally and has crossed $3 billion in annualized revenue. It is expected to significantly contribute to user growth and platform adoption, especially in sectors like education, marketing, and startups.
Its combination of functionality and accessibility makes it an attractive alternative to Google Sheets or Microsoft Excel for many use cases—particularly those that value visual communication and collaborative workflows.
Getting Started with Canva Sheets
Using Canva Sheets is as simple as:
-
Opening your Canva dashboard and selecting “Sheets” from the menu.
-
Choosing a template or starting with a blank sheet.
-
Importing or entering your data.
-
Enhancing your sheet using features like Magic Charts, Magic Insights, and more.
-
Exporting your sheet, embedding it in presentations, or sharing it with your team.
There’s no steep learning curve. If you’ve used Canva before, you’ll feel right at home.
Final Thoughts
Canva Sheets is more than a spreadsheet—it’s a creative leap forward that puts design, intelligence, and collaboration at the heart of data work. Whether you’re building marketing dashboards, educational trackers, or project reports, Canva Sheets transforms the way you visualize, share, and act on your data.
By blending the analytical strength of traditional spreadsheets with the ease and beauty of Canva’s design environment, this new tool represents a defining moment for the platform—and for anyone ready to upgrade their data game.