Why Step 1 exists
Traffic drop investigations fail for one reason: teams start fixing before they confirm the problem is real.
Step 1 is your seatbelt. It prevents you from spending two weeks “recovering” from a reporting artifact, a tracking change, or a normal seasonal dip.
Your goal here is simple:
- Confirm the drop is real.
- Confirm when it started.
- Confirm which measurement you can trust.
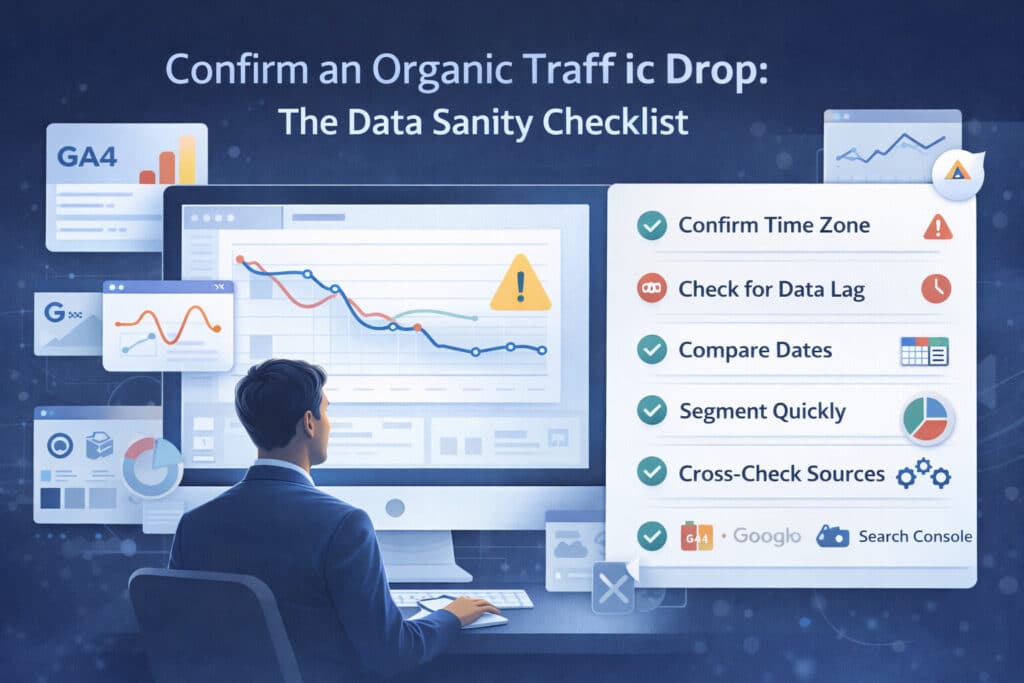
The 10-minute sanity checklist
If you do nothing else, do this. It catches the most common false alarms.
- Confirm the metric: are we talking about GA4 sessions, Search Console clicks, or revenue from organic? Different systems tell different stories.
- Confirm the time zone: GA4, Search Console, and your BI tool can be on different clocks. A “one-day drop” is often a time zone mismatch.
- Check for data lag: Search Console data is not real-time. Don’t diagnose ‘today’ based on partial data.
- Compare like-with-like: last 7 days vs previous 7 days is fine, but also compare vs the same days of week from 2–4 weeks ago.
- Look for a deployment marker: did anything ship to the site, analytics, consent, CDN, or robots file in the 48 hours before the drop?
- Check organic definition: did the channel grouping or attribution model change? Did you start excluding “(not set)” or paid brand queries?
- Cross-check sources: do Search Console clicks also drop? Do server logs show fewer Googlebot hits? If only GA4 is down, it’s usually tracking.
- Segment quickly: is the drop isolated to one country, device, or directory? If yes, stop looking for a ‘sitewide’ cause.
- Check brand trend: branded queries usually behave differently. If brand is stable but non-brand collapsed, that’s a clue.
- Sanity-check conversions: if sessions are down but conversions are flat, the business impact may be smaller than the traffic chart suggests.
Use three data sources, not one

When you’re under pressure, one chart becomes ‘truth.’ Don’t do that.
Use at least two of these, ideally all three:
- Google Search Console: for search clicks, impressions, CTR, and average position. Best for understanding search reality.
- Analytics (GA4/Adobe): for on-site behavior and conversions. Best for business impact, but vulnerable to tracking changes.
- Server logs / CDN logs: for Googlebot activity, status codes, and request volume. Best for technical verification.
- If Search Console is stable but GA4 tanked: suspect tracking/consent, not SEO.
- If Search Console and GA4 both tank: SEO/technical is more likely
- If Search Console tanked but Googlebot activity is also down: technical crawl/indexing is likely.
Confirm the exact start date
Write down the first day the curve breaks. That date becomes your anchor for every other check: deployments, algorithm updates, SERP changes, and indexing incidents.
Best practice:
- Use daily granularity.
- Mark the first day of decline and the first day you can confidently call it “a new baseline.”
- Use annotations in GA4 (or your BI tool) for deploys, launches, migrations, and policy changes.
Segmentation that matters in Step 1
Don’t over-segment yet. You’re not doing root-cause. You’re doing reality-check.
Segment only enough to confirm the drop isn’t isolated or mis-measured.
- Search Console: Web vs Image vs Video (if relevant).
- Search Console: country and device.
- Analytics: landing page and default channel grouping definition for organic search.
- Analytics: hostname (to catch staging/subdomain tracking leaks).
Common false alarms that look like SEO problems
- Consent banner or CMP update reduces measurement.
- GTM/GA4 tag removed or firing condition changed.
- New cookie restrictions or browser updates affect attribution.
- Channel grouping changes reclassify traffic away from organic.
- Search Console property mismatch (Domain property vs URL prefix property) hides part of the site.
- A report filter excludes queries/pages that previously dominated clicks.
- Seasonality and demand shifts (holidays, news cycle, product launches).
The deliverable: your incident baseline
By the end of Step 1 you should have one page that anyone can understand:
- Chart 1: Search Console clicks (daily) with the break date highlighted.
- Chart 2: GA4 organic sessions (daily) for the same date range.
- Table: top 5 landing pages by click loss (Search Console) – just enough to see if it’s localized.
- Notes: data lag considerations and any measurement changes in the same timeframe.
If you can’t produce this baseline, you’re not ready for Step 2.
FAQ
Search Console and GA4 don’t match – which one is right?
For SEO diagnosis, trust Search Console for clicks and impressions. Use analytics to understand what those clicks did on your site. If analytics is down but Search Console is flat, fix tracking before you touch SEO.
How many days of data do I need before calling it a real drop?
Enough to rule out one-day anomalies. In practice: 7–14 days is a reliable window, plus a same-days-of-week comparison if your business is cyclical.