Introduction
Selecting the right keyword match types is crucial for Google Search Ads success. In 2025, Google offers three primary match types – Broad Match, Phrase Match, and Exact Match – each balancing reach versus relevance. Recent years have seen Google dramatically redefine and favor broader match types, leveraging AI to interpret user intent. Broad match is even becoming the default for new search campaigns using Smart Bidding. However, advertisers must strategically deploy each match type to meet their specific goals (whether brand awareness, lead generation, or direct sales) and to suit their budgets (small, medium, or large). This report provides a comprehensive analysis of broad, phrase, and exact match usage in North America (especially the U.S.) as of 2025, including best practices, pros and cons, and real-world examples across industries.
Keyword Match Types in 2025: Definitions and Evolution
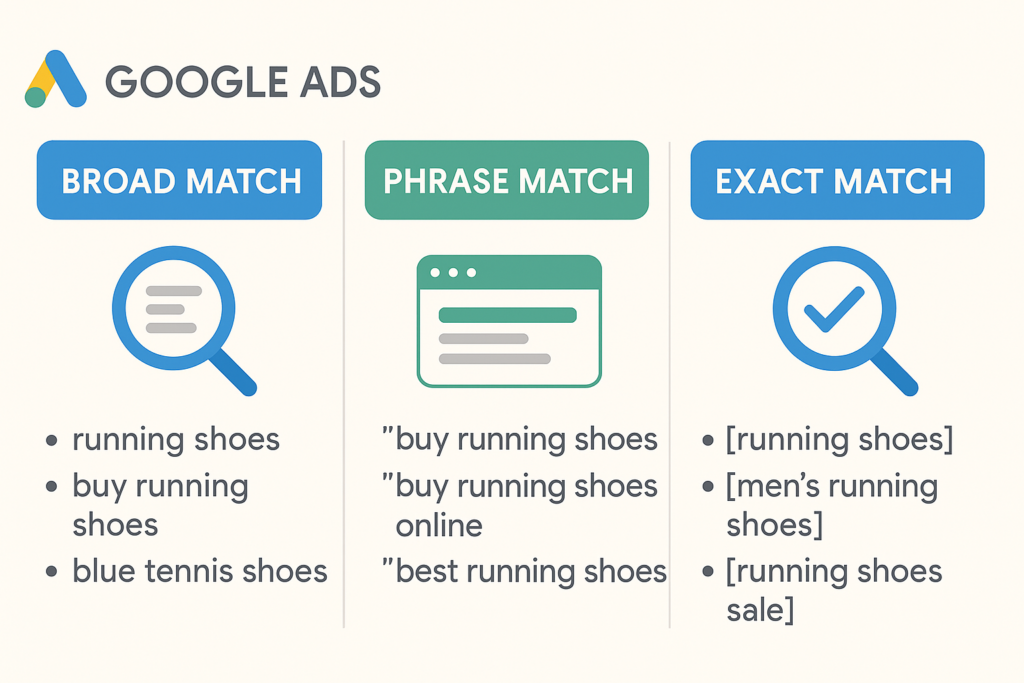
Google’s keyword match types have evolved to rely on meaning rather than exact wording. The current definitions are:
Exact Match: Ads may show on searches that share the same meaning as your keyword. (Close variants, such as misspellings or synonyms with the same intent, can trigger your ad.)
Phrase Match: Ads may show on searches that include the meaning of your keyword, allowing words before or after the phrase. (Order can matter if it changes meaning, but generally the query must retain the keyword’s intent.)
Broad Match: Ads may show on searches related to your keyword, including synonyms and other variations. (Google’s AI interprets user intent to match even if the query doesn’t contain the keyword terms at all.)
These broader definitions (introduced through updates in 2018–2021 and beyond) mean your ads can trigger for a wider range of queries than in the past. For example, as of July 2021, Google merged the broad match modifier behavior into phrase match, so phrase match now covers many variations that still carry the keyword’s meaning. Likewise, exact match is no longer truly exact – it includes close variants and same-intent queries, not just the identical phrase. Google made these changes to capture more searches (15% of daily Google queries are brand new, never seen before) and to let its algorithms deliver relevant ads based on intent rather than strict keywords.
Google’s Push for Broad Match: In its move toward automation, Google has heavily promoted broad match with Smart Bidding. In mid-2024, broad match became the default match type when creating new search campaigns with Smart Bidding. Google’s rationale is that broad match, informed by AI, can now interpret nuance and context much better than before, making it “one of the most effective solutions for search advertising” in an AI-driven world. Google’s internal data claims that “broad match gives you the most relevant reach and conversions within your performance goals”. As a result, 62% of advertisers using Smart Bidding have broad match as their primary match type. This trend forces advertisers to adapt – but it’s crucial to examine broad match’s performance in practice versus Google’s promises.
The sections below break down each match type – broad, phrase, and exact – discussing their advantages, disadvantages, and best-use scenarios. We then delve into how to mix and match them for different campaign goals and budget sizes, with a focus on North American market practices.
Broad Match: Maximum Reach, AI-Driven Intent Matching
Broad match keywords are the most inclusive and “flexible” option. By default, a broad keyword tells Google it can match your ads to any search related to that keyword – including synonyms, plural/forms, misspellings, and even searches that don’t contain the keyword words but are deemed relevant in intent. For example, a broad match keyword “running shoes” might trigger searches for “sneakers for running,” “athletic footwear,” or “best shoes for jogging”. Thanks to advanced AI, broad match now understands user queries on a deeper level, catching nuances that old algorithms missed (e.g. it knows “treating a pet at home” is related to “without a vet,” whereas legacy broad would not have).
Pros of Broad Match:
Widest Reach & New Query Discovery: Broad match casts the widest net, helping you discover new, relevant queries you might not have thought of. It’s excellent for top-of-funnel reach and campaigns focused on awareness or discovery. Broad keywords will reach all the searches that your phrase and exact keywords could reach – plus more. This can uncover valuable long-tail searches or emerging trends, capturing additional traffic and expanding your audience. Google engineers note that continuous AI improvements have “supercharged” broad match’s ability to identify user intent, markedly improving its relevance over earlier years.
Simplified Keyword Management: Using broad match can reduce the need to maintain exhaustive keyword lists. Rather than adding hundreds of slight variations, a single broad term can cover them. This “streamlines keyword management”, allowing marketers to focus on optimizing ads and bids instead of compiling keywords. This benefit is especially pronounced in large accounts or ecommerce with many products, where broad match can automatically catch queries for new products or niches without manual keyword additions.
Leverages Google’s Machine Learning: Broad match fully exploits Google’s AI signals (such as user behavior, past searches, real-time context) to decide when your ad should show. When paired with Smart Bidding, broad match lets Google adjust bids dynamically and find converting traffic you might miss with tighter match types. Google asserts that broad match is the only match type that uses all available auction-time signals for matching and bidding. If you use a conversion-based bidding strategy (like Target CPA or Maximize Conversions), Google’s AI can combine with broad match to maximize results within your goals. Many advertisers have found success with this combination: Google reported that advertisers who **“upgrade” exact keywords to broad match in **tCPA (target CPA) campaigns see 35% more conversions on average. As a real example, Meetic Group (a leading online dating company) tested broad match with Smart Bidding and achieved a 70% increase in conversions while still meeting their CPA targets, calling broad match “one of our strategic tools for growing Search”. Another case, tails.com in the UK, used broad keywords + responsive search ads + Smart Bidding and increased sign-ups by 182% (with 258% more clicks) when expanding into a new market. These cases illustrate broad match’s potential when harnessed properly.
Lower CPC Potential: Broad match can sometimes yield lower average cost-per-click. It often dips into less competitive, longer-tail queries that exact or phrase might miss. Some advertisers observe they can get clicks cheaper via broad match on obscure but relevant searches. (However, whether this translates to better cost-per-conversion is not guaranteed – see cons below.)
Cons of Broad Match:
Lower Relevance & Risk of Irrelevant Traffic: The biggest drawback is that broad match often matches to irrelevant or loosely related searches, especially if keywords are not highly specific. While Google’s AI is improving, it’s not infallible. Broad terms can trigger ads on searches with a very different intent, leading to wasted spend on unqualified clicks. For example, an advertiser selling running shoes who uses broad match “shoes” might have their ad shown to people searching for “high heels” or “dress shoes,” which is clearly not relevant. Advertisers “have to keep a heavy leash” on broad keywords, as one expert put it, because broad match can go haywire if left unchecked. Irrelevant clicks not only drain budget but also drag down metrics like click-through rate (CTR) and conversion rate. In fact, a large Optmyzr study of ~2,600 accounts in 2023 found that in 85.6% of accounts, CTR was higher with exact match than with broad, indicating broad keywords often delivered less relevant traffic that users were less inclined to click. Similarly, conversion rates were higher on exact match in 56.7% of accounts (only 22.7% saw better CVR with broad). These numbers reflect that broad match, on average, tends to be less efficient in turning clicks into conversions when compared to tighter match types. Advertisers must vigilantly filter out poor matches. Using negative keywords is essential – for instance, excluding terms like “free,” “jobs,” or other non-converting intents that broad match might latch onto. (Google Ads now even allows negative keywords at the account level to help control broad match spread.)
Reduced Control and Transparency: With broad match, you relinquish a degree of control to Google’s algorithms. You don’t specify exactly which queries trigger your ads, so your ad could appear on a wide array of queries you never explicitly targeted. This can be problematic for brands with specific messaging or for sensitive industries where ad context must be tightly regulated. For example, a medical services advertiser might find a broad keyword matching to symptoms or queries outside their practice area. Additionally, Google’s search terms report (which shows the actual queries that triggered your ads) has limitations – it may not show every query, especially low-volume ones. Some PPC experts complain that “valuable search terms [are] triggering under broad match but being hidden from search term reports”, making it hard to fully assess what broad match is doing. This opacity means you might be paying for queries you can’t easily identify, complicating optimization.
Potentially Higher Costs per Action: While broad match can lower CPCs in some cases, it doesn’t always mean lower cost per conversion. If many broad clicks are irrelevant or low intent, you may end up paying for more clicks to get one conversion, raising your CPA. The Optmyzr analysis showed that in ~70% of accounts, exact match yielded a lower CPA than broad match – and similarly, exact gave better ROAS in ~72% of accounts studied. These findings “directly contradict Google’s blanket claims about broad match superiority”. In other words, broad match can increase conversion volume (Google’s 35% claim), but often at the cost of efficiency if not carefully optimized. Advertisers chasing direct sales or ROI need to watch this closely.
Best Practices for Broad Match:
Use Broad Match in Combination with Smart Bidding and Conversion Tracking: Broad match is strongly recommended to be used with automated bidding (Target CPA, Target ROAS, or Maximize Conversions) and proper conversion tracking in place. The algorithmic bidding will help decide when a broad match query is likely to lead to a conversion within your goals, and adjust bids or skip auctions accordingly. If you run broad keywords on manual bidding or without conversion data, you risk paying for many irrelevant clicks since the system isn’t optimizing toward a defined outcome. A general guideline is to have a solid base of conversion history (Google suggests ~15+ conversions per month minimum for Smart Bidding to work well) before leaning into broad match.
Be Highly Intentional with Keyword Selection: To mitigate broad match’s downsides, start with well-chosen broad keywords that are closely tied to your products or services. Avoid one-word broad keywords or very generic terms (like “shoes”) unless you have a very large, generalized campaign. Instead, use more specific broad terms that imply intent. For example, broad match “women’s running shoes” is safer than just “shoes”; “family law attorney” as broad is likely better than just “attorney,” which could match anything law-related. The more specific the seed keyword, the more relevant Google’s “related” matches tend to be.
Leverage Negatives and Ongoing Search Query Monitoring: Treat broad campaigns as living organisms that need continuous pruning. Immediately implement negative keywords for any irrelevant queries that slip in. Common negatives used across many broad campaigns include filtering out research-oriented or low-intent terms (e.g., “what is”, “how to”, “example”), job/career terms if you’re not hiring (e.g., “jobs”, “salary”), and unrelated product categories. Regularly check the search terms report – at least weekly – to catch new unwanted matches and add them to negatives lists. Over time, a robust negative list will significantly improve broad match efficiency.
Consider Separate Broad Match Campaigns or Experiments: Many advertisers choose to isolate broad match keywords in their own campaign or ad groups. This way, you can assign them a specific portion of budget and avoid them cannibalizing spend from your exact/phrase keywords. Google now even offers a “broad match only” campaign setting (for campaigns using conversion-based bidding) – enabling it converts all keywords in that campaign to broad match. Whether or not you use that feature, conceptually separating broad match traffic can make it easier to control and measure. Running an experiment (A/B test) is also a great approach: for instance, test a broad-match heavy strategy versus a phrase/exact strategy for the same campaign to see which yields better results. One e-commerce DTC brand did exactly this with a 50/50 experiment on their search campaigns – and reported that the broad match version drove more conversions at a cheaper cost (with search terms that “weren’t too irrelevant”) compared to their phrase match campaign. Such tests can help validate whether broad match adds value in your specific case.
Watch Out for Internal Competition & Prioritization: When you use broad alongside phrase and exact, be aware of Google’s keyword prioritization rules. Normally, an exact match keyword will trump a broad match keyword if both could match the same query. However, if you’ve enabled certain broad match campaign settings or if close variants muddy the waters, you’ll want to ensure your important exact keywords aren’t losing impressions to broad match. One way is using negative keywords to block broad keywords from matching queries that your exact keywords cover (sometimes called a “negative keyword sculpting” technique). In practice, though, Google’s AI often chooses the “more relevant” match, which usually favors exact or phrase when identical terms are searched. It’s still wise to keep an eye on impression distribution to ensure broad isn’t stealing traffic that a tighter match type should handle.
In summary, Broad Match in 2025 is a powerful tool for reach and discovery, supercharged by Google’s AI. It can drive significant volume – and even efficiency – if used under the right conditions (smart bidding, sufficient budget/data, active management). It’s particularly useful for expanding a campaign that has hit a plateau with strict keywords. However, broad match should not be your only match type in most cases. As one industry publication put it: broad keywords are great for scale, but “they should be used alongside other match types for balance”. A balanced approach ensures you capitalize on broad match’s reach while exact and phrase keywords keep the relevance and efficiency in check.
Phrase Match: Balancing Reach and Relevance
Phrase match is the middle ground between broad and exact. In its current form (post-2021 update), phrase match allows your ad to show when the search query includes the meaning of your keyword phrase, but it limits matches to queries that contain that meaning in context. Traditionally, phrase match required the query to contain the exact phrase (or close variants) in the same word order. Now, word order can be flexible if it doesn’t change the intent. For example, if your phrase keyword is “best pizza in Chicago”, your ad might show for “cheap best pizza in Chicago” or “find the best pizza in Chicago suburbs” – words can be before or after, and slight additions in between are allowed. However, it wouldn’t match a query like “Chicago best pizza” if the system thinks the meaning differs (likely it would match in this case since it’s just a reordering – but a radically different phrasing that doesn’t imply “best” might not match). Phrase match essentially captures searches “that include your target keyword (or its close variants) in the query, in a context that preserves the keyword’s intent.” It also inherits the functionality of the now-retired Broad Match Modifier, meaning your keywords’ important terms must be present in some form in the search.
Pros of Phrase Match:
Good Balance of Reach vs. Control: Phrase match is often touted as offering “a balance between flexibility and control”. It expands reach beyond exact match by allowing variation, yet it’s far more targeted than broad match. Your ad only shows when the user’s search includes your keyword phrase (or a close variation of it). This generally ensures the query is relevant to your keyword’s theme. Phrase match is ideal when you want to capture users who are searching on your core concept, but with slight variations (e.g., different adjectives, additional qualifiers). It hits that mid-funnel sweet spot – more volume than exact, but more relevance than broad. Many advertisers rely on phrase match as the workhorse for capturing qualified traffic without the extreme unpredictability of broad. “Phrase match is ideal when you want a balance of reach and relevance,” as one agency guide notes. It’s a popular choice for moderate budgets where you need efficiency but also enough scale.
Higher Relevance & CTR (Compared to Broad): Because the user’s query must contain the keyword (or close synonym) in context, phrase match tends to produce more relevant matches than broad. Irrelevant impressions are fewer, especially if your phrase keywords are well-chosen. This typically leads to higher click-through rates than broad match. (While exact usually has the highest CTR, phrase is often a close second.) In practice, phrase match often captures users with medium to high intent, since their search includes your specific terms. For example, a person searching “affordable CRM software for small business” will match a phrase keyword “CRM software” – their intent is likely relevant to buying CRM software, even if they used additional words. You would expect a decent CTR and conversion chance on that. In contrast, broad might match “CRM software” to something like “customer management tool alternatives” which might be a different intent or research phase, potentially lower CTR. Thus, phrase can deliver quality traffic more consistently.
Covers Variants & Long-Tails (Efficiency Gains): Phrase match’s allowance for words before/after means one phrase keyword can cover many long-tail searches that contain that phrase. This reduces the need to list every permutation as exact match keywords. For instance, phrase “running shoes” can match “best running shoes for flat feet” or “running shoes under $100”, etc. Advertisers get some of broad’s reach without all of broad’s chaos. It’s an efficient way to broaden coverage while maintaining tighter alignment with user queries. Google has indicated that the updated phrase match is even more precise than the old broad-match-modifier approach, helping improve campaign performance by cutting truly irrelevant matches.
Predictable Keyword Intent for Ad Copy: With phrase match, since you know the query will contain your keyword (or close variant), you can craft ad copy and landing pages to align with those phrases. This can improve Quality Score through higher ad relevance and landing page relevance. For example, if you use phrase match “Miami plumber”, you can ensure your ad headline is “Miami Plumber Available 24/7” – and you’re confident the user’s query had “Miami plumber” in it or very close. This alignment is a bit harder with broad, where the query might be something like “fix leaking pipe Florida” – related but not containing “plumber,” which could make your “Miami Plumber” ad feel slightly off. Phrase match gives you a level of messaging consistency that broad sometimes lacks.
Cons of Phrase Match:
Still Some Loss of Control vs. Exact: Phrase match is not immune to mismatches. While it’s more controlled than broad, phrase keywords can still match to searches that include your words but have a different intent. For example, the phrase keyword “used cars” could match a query “used cars movie” (a film title) – which is irrelevant to selling cars. Google’s intent understanding might filter that out, but there’s no guarantee; advertisers have observed occasional odd matches even on phrase. So you must still monitor search terms and add negatives for phrase campaigns, though typically not as many as broad requires. Another issue is close variants: phrase match will match plurals, misspellings, and sometimes synonyms of the phrase. If Google deems a synonym as having the same meaning, it can match – which may or may not be desired. E.g., phrase “car insurance” might match “auto insurance” searches (synonymous meaning). Usually that’s fine, but if for some reason your offering is specific to “car” vs “truck” or such, you’d need to control that.
Limited Reach vs. Broad: The flipside of being safer than broad is that phrase match will not reach some search queries that broad could. If a user’s search doesn’t contain your keyword (or a close variant) at all, phrase match won’t trigger your ad. You might miss out on some relevant searches that use different vocabulary. For instance, a query for “job management software” won’t match phrase “project management software,” even if the user’s intent might be similar, because none of the words “project management software” are in the query. Broad match could have shown your ad there by recognizing the similarity, but phrase won’t. Thus, relying solely on phrase could leave some traffic on the table – traffic that could be valuable – simply because the phrasing is different. In markets where people use a wide variety of terms for the same thing, this is a limitation.
Requires Building Keywords for Major Variations: To cover different ways people might phrase something, you may still need multiple phrase match keywords. For example, if you’re a personal injury lawyer, you might use phrase “personal injury lawyer” but you might also need “personal injury attorney” as a separate keyword to catch that variant (since Google might not equate lawyer and attorney automatically in phrase match – they might, but not guaranteed as a “close variant”). Similarly, singular/plural or related concepts might need their own entries if you want to be sure to cover them. So while phrase reduces the keyword list compared to exact-only approach, it still involves some level of keyword expansion to cover key synonyms or category terms.
Performance Can Be Midrange: In terms of performance metrics, phrase match often falls between exact and broad. It won’t typically beat exact match on conversion rate or CPA efficiency because phrase still allows some broader matching that can lower averages. And it won’t capture as much volume as broad. This is expected (it’s a trade-off by design). However, it’s worth noting if your goal is maximum efficiency (lowest CPA), exact might outperform phrase; if your goal is maximum volume, broad will outperform phrase. Phrase is the compromise, so ensure that compromise aligns with your campaign goals. In many lead generation campaigns, for example, advertisers favor phrase match because it delivers qualified leads at a reasonable CPA – not as low as exact perhaps, but a good balance.
Best Practices for Phrase Match:
Use Phrase Match for Mid-Funnel and Core Generic Terms: Phrase match shines for keywords that are neither ultra-specific nor completely generic. It’s often recommended to use phrase for mid- to bottom-funnel searches – those that indicate interest but maybe not the final stage. For instance, someone searching “compare life insurance quotes” is showing intent (researching to potentially buy) and a phrase match “life insurance quotes” would catch that and similar queries. This person is not as definitely ready to convert as someone searching “buy Acme Life Insurance now” (which would be an exact-match candidate), but they’re more promising than someone just searching “insurance” (which broad might grab). By aligning phrase match with these mid-level queries, you balance getting volume and maintaining relevance. One 2024 PPC guide suggests: “Use broad match for top-of-funnel campaigns to attract a wide audience, and use phrase match for mid-to-bottom-funnel campaigns, focusing on users with more specific intent”. In practice, this might mean using phrase match on your important product/service category terms and any common longer searches your audience uses that are still somewhat general.
Monitor Search Queries and Refine: Just like broad, you should keep an eye on the search terms report for phrase match keywords. Look for any recurring queries that don’t fit your business, and add them as negatives. Phrase match may not produce the wild variety of broad, but it can still surprise you. For example, if you use phrase “software consulting”, you might find queries like “free software consulting” or “software consulting jobs” slipping in – both of which a B2B consulting firm would want to exclude (one due to low commercial intent, the other because it’s job seekers). Regular maintenance of negatives ensures phrase match stays efficient. As another measure, if a phrase keyword consistently matches to a particular search term that performs exceptionally (or poorly), consider adding that search term as its own exact keyword (or a negative if it’s bad) – this gives you finer control. This practice, often called “query mining”, is a way phrase and broad are used to discover strong exact-match candidates to add to your account.
Leverage Phrase Match in Conjunction with Exact and Broad: A savvy strategy is to use a mix of match types for the same set of concepts. For example, you might have an exact match keyword for your highest-value term (ensuring you capture it precisely), a phrase match for that term to catch variations, and a broad match to explore new related searches. The key is to manage them so they don’t compete in an unwelcome way. Typically, Google will prefer the exact match if the user query exactly matches it. By having phrase and broad alongside, you ensure you’re not missing out on traffic. The phrase will pick up close variations that the exact might miss (due to not having those words in exact form), and broad will cast wider still. Advertisers often put bid or budget priority on exact, then phrase, then broad. If using manual bidding, you might bid exact keywords higher (since they convert best), phrase somewhat lower, and broad lower still, to reflect their expected conversion rates. If using automated bidding, you might separate them into different campaigns to allow budget weighting (e.g., a controlled budget on broad discovery campaigns). Google’s recommended best practice is indeed to “combine match types” and let Smart Bidding handle the rest. They even provide tools (like a one-click “ broad match experiment” recommendation) to test adding broad alongside existing keywords. Overall, phrase match plays a pivotal role in such a multi-tier strategy as the middle layer capturing both exact-level and broad-level traffic.
Use Phrase for Local or Niche Targeting: If you are targeting specific locations or niche offerings, phrase match can be very effective. For example, consider a local service like “bathroom remodeling in Dallas.” A phrase match keyword set to “bathroom remodeling in Dallas” will match variants like “affordable bathroom remodeling in Dallas” or “Dallas bathroom remodeling company”, ensuring you show up for local searches containing that phrase. It locks in the locality and service, giving you tight targeting, while still catching common adjectives or word order changes. Exact match in this scenario might be too narrow (you’d need separate keywords for every slight variation), and broad might attract unrelated queries (like “kitchen remodeling Dallas”). Phrase is just right for such cases. Advertisers often use phrase match for long-tail keywords that include a core phrase – it’s a way to cover those long-tails without writing every possible variation.
Overall, Phrase Match in 2025 remains a reliable choice for most advertisers. It is often recommended as the “go-to” match type for balancing scale and precision, especially if you have a moderate budget and need to make every dollar count while still growing reach. It works well across industries for capturing relevant traffic and is typically easier to manage than broad (fewer surprises) while yielding more traffic than exact. As one U.S. marketing firm summed up: “Phrase Match helps maintain relevance and capture phrases with slight flexibility”. This flexibility-within-limits is why phrase match is the backbone of many search campaigns.
Exact Match: Precision Targeting for High Intent
Exact match is the most restrictive keyword match type. An exact match keyword tells Google to show your ad only when the user’s search query is a close variant of that keyword – effectively, when the search has the same meaning or intent as the keyword. Historically, exact match meant the search had to be identical to the keyword (minus minor punctuation or plural differences). Today, it’s loosened slightly: the search can include reordered words, plural/singular, misspellings, or very close synonyms and still match. But it won’t match to queries that Google deems to have a different intent. For example, if your exact keyword is [organic dog food], Google might show your ad for “organic dog food” (word-for-word match) or “dog food organic” (reordered) or “organic food for dogs” (same intent rephrased). It might even match “natural dog food” if Google believes “natural” is synonymous with “organic” in this context (close variant intent). However, it should not match something like “healthy dog food” if Google decides that “healthy” is a broader concept than “organic”. In practice, exact match gives the highest control – your ads trigger on what you consider the exact keywords that matter, with minimal unexpected variations.
Pros of Exact Match:
Highest Precision & Relevance: Exact match offers maximum control over when your ads appear. If you only want to show ads to users who type a very specific query, exact match is the tool. This precision means that the traffic you get is highly relevant by definition – they searched exactly what you’re targeting. As a result, exact match keywords typically have the highest click-through rates (CTR) and conversion rates among the match types. Users see your ad precisely addressing their search, so they are more likely to click and convert. Data supports this: the Optmyzr study found 85% of accounts had better CTR with exact match than broad, and ~57% saw higher conversion rates with exact vs broad. Advertisers often observe that exact match campaigns deliver the “highest quality traffic.” For instance, an exact match keyword like [buy Nike Air Max 270] will pretty much only get you people explicitly looking to buy that product, who are very likely to convert. This laser-focused relevance is invaluable for direct sales goals and high-intent lead generation.
Lower Wasted Spend, Higher ROI Potential: Because exact match avoids the randomness of broader matches, you spend budget only on queries you know are pertinent. This tends to result in efficient use of budget – little is wasted on unqualified clicks. If you have a tight budget, exact match ensures those limited dollars go toward the most relevant searchers. One agency explicitly advises: “If your budget is tight, focus on Exact Match to conserve your budget for the most relevant traffic.”. Many small businesses and niche industries prefer exact match for this reason; they can’t afford to pay for curiosity clicks or broad queries that don’t convert. Additionally, exact match often yields strong conversion economics (CPA, ROAS). In competitive sectors (legal, healthcare, etc.), some advertisers use almost exclusively exact match and report excellent ROI. For example, a U.S. marketing professional managing large accounts in healthcare and legal noted they shifted to ~95% exact match keywords (eschewing broad and even phrase) and “the ROI has never been better”. By only bidding on the precise queries that historically convert well (and excluding everything else), they achieved very efficient ROI at scale – even spending over $1.3M/month on mostly exact keywords. This underscores how exact match can be highly profitable when you know your “money keywords.”
High Quality Scores and Ad Rank (for relevant ads): When your keyword, ad copy, and landing page all line up perfectly with the user’s query (which is easiest to do with exact match), you tend to see higher Quality Scores. Google rewards relevance. Exact match keywords often have high click-through rates, which boost Quality Score, which in turn can lower your cost per click for a given position. Also, since exact match keywords compete in auctions most relevant to them, you avoid competing in a bunch of loosely related auctions (as broad might). All this means you can achieve a given volume of clicks at a lower cost with exact match in many cases, provided the query volume exists. In short, Exact match maximizes the efficiency and effectiveness of your ads for specific search intents, making it ideal for bottom-of-funnel conversions – those ready-to-buy searches, brand keywords, and other high-value terms.
Predictability and Ease of Measurement: With exact match, campaign performance is easier to analyze. Each keyword corresponds closely to a search intent, so you can attribute conversions or revenue to specific queries with confidence. There’s less noise in the data. For optimization, you can adjust bids per keyword knowing exactly what query that affects. This granularity and predictability make exact match appealing, especially to seasoned PPC managers who want fine-grained control.
Cons of Exact Match:
Limited Reach and Scale: The strictness of exact match inherently means you’ll capture far fewer impressions than you would with phrase or broad for the same topic. If users search in ways that don’t exactly match your keywords, your ads won’t show. Exact match has the smallest reach of the match types. For campaigns focused on growth or awareness, exact by itself can be too narrow. For example, if you sell a niche product, there might be 100 different ways people could search for a solution that your product offers. Covering all those with exact match keywords alone is extremely challenging – you risk missing a lot of them (and 15% of searches each day are completely new, so you literally can’t have all of them pre-figured). This is why solely relying on exact match can “under-perform” in terms of volume. Exact match campaigns often top out once they’ve captured the bulk of searches for those specific terms. If you want to scale beyond that, you have to add more exact keywords (which may involve guesswork or constant query mining) or loosen match types. In Jyll’s words (a Google Ads coach), “Exact match keywords can’t scale” easily – managing hundreds or thousands of exact keywords becomes a “logistical nightmare” as you grow. It’s fine for a small account, but unwieldy at enterprise scale without help from automation.
Higher Management Effort: As implied above, maintaining a large set of exact match keywords can be resource-intensive. You must research and add new exact terms to catch every relevant query variation. If you don’t, you’re leaving potential traffic untouched. Additionally, monitoring and updating bids for a long list of exact keywords is time-consuming (though automated bidding can alleviate this). Contrast this with broad, where you might manage 100 broad keywords to cover the same ground as 1,000 exact keywords – broad pushes more of the work to Google, whereas exact requires your intervention to expand and refine. If you have limited time or lack a dedicated PPC manager, running only exact match might mean you’re not adapting quickly to search trend changes.
Possible Higher CPCs on Competitive Terms: Exact match keywords often include the most lucrative, high-intent terms – which means many advertisers bid on them. This competition can drive CPCs up. For example, the exact match [personal injury lawyer near me] could be extremely expensive per click (because all law firms want those clicks), whereas a broader match might sometimes sneak you into cheaper queries like “should I get a lawyer for minor car accident” (which fewer advertisers explicitly target). So while exact match has high conversion rates, the cost per click for top exact keywords can be steep. If not managed properly, that can mean high cost per acquisition as well, especially if conversion rates don’t offset the CPC. Google’s automation sometimes finds that broad match can get conversions at lower CPA precisely by entering cheaper auctions – though as noted, the overall data often still favors exact for CPA/ROAS. Advertisers should keep an eye on CPCs and perhaps use automated bidding to ensure they don’t overpay on exact terms (or use bid strategies like Target CPA/ROAS to stick to efficiency goals).
Less Flexibility for Variant Matching: Although Google expanded what exact match covers (by including close variants), it can still be too literal at times. If Google doesn’t recognize that two searches have the same intent, your exact keyword won’t match the variant. For instance, if your exact keyword is [email marketing software] and a user searches “email marketing tool”, ideally one would think that should match (since tool vs software is essentially the same intent). Google might match it as a close variant, but if not, you miss that user unless you had [email marketing tool] added as well. Historically, advertisers needed lists of exact synonyms and misspellings. Google has improved this with semantic matching in exact, but it’s not perfect. In short, exact match can sometimes be too rigid – requiring you to anticipate and add every meaningful variant that might not be caught automatically. If you fail to do so, you may not appear for some searches where you really would have wanted to. This is more of a minor con now (since Google does a lot of heavy lifting with close variants), but it’s still a consideration. Notably, Google’s increasing reliance on AI means that even exact match is being “stretched” – there is industry observation that Google treats exact match more and more like broad match in terms of intent matching. This is meant to help with coverage, but to advertisers it means exact match isn’t as exact as it used to be. You might occasionally find an exact keyword matched to something that surprises you (in theory still the same intent, but arguable). So control is slightly eroding: one must watch exact match search terms too, particularly if Google’s interpretation of “same intent” differs from yours. For example, an exact keyword [GMAT classes] could conceivably match “MBA entrance prep classes” if Google thinks it’s the same intent – an aggressive variant that the advertiser might not agree with. When such cases occur, adding negatives or splitting hairs with exact synonyms might be needed to steer Google.
Best Practices for Exact Match:
Start with Exact for Core, High-Intent Keywords: It’s widely recommended to use exact match for your most critical keywords – the ones that directly align with your product/service and indicate strong commercial intent. These often include brand keywords (your company or product names), as well as top performing non-brand terms (for example, an apparel retailer might exact-match “buy [Brand] jeans” or “[Brand] coupon” and category terms like “[Brand] deals”). If you know certain terms convert extremely well, exact match guarantees your ad shows for those and you can tailor bids to maximize presence. For lead gen and B2B, this might be specific service queries like “hire [specific service] company [Location]” or product-specific searches. By securing these with exact match, you ensure competitors or broad match variations don’t cause you to lose impression share on them. Brand protection is a key use case: always have your brand and product names as exact match keywords, so you dominate those searches (often using Target Impression Share bidding to appear nearly 100% of the time).
Employ Bid Strategies and Priority for Exact Keywords: Given their value, you may want to bid more aggressively on exact matches. If using manual CPC, allocate higher bids to exact keywords to win top positions (their high Quality Scores often help, but competition can be stiff). If using automated bidding, consider separating exact keywords into their own campaign with a specific target (like a target CPA or ROAS that reflects their strong performance). This avoids mixing exact and broad in one portfolio where broad might dilute the bidding or budget. Google’s keyword prioritization logic also states that identical exact matches take precedence – so having an exact keyword in your account prevents a broad or phrase from showing for that same query. This is good, but note that if you put exact and broad in the same campaign with shared budget, the broad could still eat spend on other variants. Some experts therefore put exact, phrase, broad in separate campaigns with dedicated budgets, ensuring exact gets funded first (since exact is most likely to convert) and broad uses “leftover” budget for exploratory traffic. This approach aligns with a tiered strategy: exact = highest priority, phrase = medium, broad = lowest priority.
Maximize Ad Relevance and Landing Page for Exact Terms: With exact match, you know exactly what users are searching. Take advantage of that by writing highly relevant ad copy that mirrors the query and landing pages that address the query. This not only improves performance but also can further boost Quality Score and reduce CPC. For example, if your keyword is [emergency plumber Miami], ensure the ad headline says “Emergency Plumber in Miami – 24/7 Service” and send them to a page about emergency plumbing in Miami. By doing so, you’ll likely achieve a very high ad relevance and a great user experience, yielding a strong conversion rate. This technique is less feasible with broad because you can’t customize ads for every possible query, but with exact you can create tightly themed ad groups (sometimes even single-keyword ad groups, SKAGs, though Google has moved away from recommending SKAGs now). Still, the principle stands: exact match lets you deliver a very targeted message, so make use of it.
Use Exact Match for Budget Control: If you have a fixed small budget (e.g., a local business with only $500/month for search ads), it’s often wise to stick mostly to exact (and some phrase) to ensure that money isn’t wasted. Exact match will focus your spend on the most likely converters. As Impact Group Marketing put it, exact match “ensures your budget goes toward highly relevant clicks”. If you see success and want to expand later, you can loosen to phrase or broad gradually. But starting with exact for budget-limited advertisers is a common best practice. It’s essentially guaranteeing as high an ROI as possible for each click, at the cost of potentially not getting as many clicks.
Augment Exact Match with Other Tools for Scale: Recognizing exact’s scale limitations, you can complement your exact keyword strategy with other campaign types or match types for coverage. For instance, running Dynamic Search Ads (DSA) can capture additional relevant searches based on your website content, without adding those as keywords – useful to catch queries you didn’t think of while you keep your keyword list tight. Jyll Saskin Gales, a former Googler, suggests using broad match with Smart Bidding or DSAs to “reach a wider audience and capture relevant search queries you might have missed”, instead of relying solely on exact match keywords. Essentially, exact match is great for known high-performers, but don’t be afraid to let Google’s automation (broad match or DSA) work in tandem to find new opportunities. When those new queries prove their worth, you can always add them as new exact keywords too. This hybrid approach mitigates exact’s main weakness (limited discovery) while preserving control over core terms.
In summary, Exact Match remains the go-to for maximizing relevance and conversion efficiency. It’s particularly critical for capturing bottom-of-funnel searches and protecting key terms (like brand names or specific product queries). Many North American advertisers, facing fierce competition and high CPCs, continue to lean on exact match for its reliability and ROI – as evidenced by case studies in legal and healthcare where exact-heavy strategies “crushed” it. But exact match alone is rarely sufficient for growth; hence the modern best practice is to use exact match in concert with phrase and broad, letting each play its role. As one resource succinctly put it: “Broad Match is for reach and discovery; Phrase Match for relevant phrase flexibility; Exact Match for precision and control.” Using them together allows an advertiser to cover the full spectrum of the search funnel effectively.
Strategic Use of Match Types by Campaign Goal
Advertisers should adjust their match type strategy depending on the specific goals of a campaign. The optimal mix for a brand awareness campaign may differ from that of a lead generation or direct sales (e-commerce) campaign. Below, we explore how broad, phrase, and exact match can be used strategically for these three common goals:
Brand Awareness Campaigns
Goal: Maximize visibility and reach to expose the brand or product to as many relevant users as possible (even if they’re not ready to convert immediately). Success is often measured in impressions, clicks, and uplift in brand searches or website traffic, rather than immediate ROI.
For brand awareness on Search, you typically want to cast a wide net and get your name in front of a broad audience in your industry/category. Broad match keywords are very useful here due to their expansive reach. Broad match allows your ads to show on a variety of queries related to your brand or product category, which is ideal for reaching new people. For example, a new fitness apparel brand aiming for awareness might bid on broad keywords like “workout clothes” or “gym outfits.” Their ads could then appear on many long-tail searches (e.g. “best clothes for gym class” or “yoga outfit ideas”) that indicate interest in that realm. Even if those users aren’t specifically searching for the brand, the ad exposure builds recognition. Broad match paired with a Maximize Clicks or Target Impression Share bidding strategy can be powerful – the former drives as much traffic as budget allows, and the latter can ensure your ads show almost all the time for certain broad queries. However, a note of caution: if using Target Impression Share (to appear, say, 90% of the time on a set of queries), you might actually prefer phrase or exact for that, according to Google’s guidance. That’s because with impression-share goals, you’d want to focus on specific high-value queries (maybe your brand terms or a key generic), rather than letting broad match show you on anything and everything. In practice: For awareness, you might use broad match on category terms with a moderate CPC bid to gather wide impressions, while separately ensuring you have exact match on your own brand name to capture those searches (brand campaigns often run on exact match with a target impression share of 100% – you want to always show for your brand).
The pros of broad match in awareness are clear: volume and diversity of exposure. You might reach segments of the market you hadn’t identified. Additionally, broad match in awareness campaigns can be combined with audience targeting (like observation audiences or demographic bid adjustments) to refine who sees your broadly-triggered ads, ensuring relevance. For example, a luxury fashion brand might use broad keywords for “handbags” but then use demographic filters to bid higher for female users aged 25-54, aligning reach with their target audience.
Phrase match can also play a role in awareness if you want a bit more control. If the broad approach is too wide and budget is getting spent too quickly on marginally relevant impressions, you might tighten to phrase match for some keywords. Phrase will still increase reach beyond exact, but it will require that a specific phrase is in the search. For instance, a car company doing a brand awareness campaign for their new electric SUV could use phrase match on “electric SUV” – ensuring ads show when that phrase is in the query (like “best electric SUV 2025”, “affordable electric SUV”), but not on queries that don’t specifically mention SUV or electric together. This focuses the impressions on somewhat relevant context. Exact match is less common as a primary tool for pure awareness, since by nature exact targets specific known queries (which limits reach). The exception is exact match for brand terms: any awareness campaign should absolutely cover the brand’s own name in exact match, so that if someone does search the brand after seeing other ads (or any time), your ad shows prominently. Brand exact keywords often have very low CPCs and high quality scores, so it’s inexpensive to run them. They ensure you occupy the real estate for your name, fending off competitors. For awareness, you might also exact match some key industry terms if you want to appear for them 100% (for example, a new tech gadget brand might exact bid on “VR headset” with a high impression share target to dominate that term and build association, though that blurs into consideration intent).
A real-world example of using broad match for awareness: LEGO, the toy brand, might run a campaign to promote STEM toys to parents. They could use broad match on “educational toys” or “kids science kits” to reach a wide set of searches (like “best educational toys for 5 year olds”, “science kits for kids near me”, etc.).
The goal is to show LEGO’s ad to as many interested parents as possible, even if they weren’t explicitly searching for LEGO. Over time, this can increase branded searches and direct traffic as people become aware of LEGO’s STEM toy line. LEGO would monitor the search terms and add negatives for irrelevant stuff (e.g., if “educational toys” broad started matching to “educational toy storage ideas” – irrelevant – they’d negative out “storage”). They would also use captivating ad creatives emphasizing brand and product benefits, since the objective is to leave an impression. If budget permits, they could aim for a large impression share on those broad terms, accepting a higher cost to ensure visibility.
One more point: Budget allocation for awareness – typically, awareness campaigns have larger budgets (or a separate budget) because you’re intentionally reaching wider and accepting lower immediate returns. In North America’s large market, using broad match for awareness can spend a lot quickly given the high search volumes. So advertisers often geotarget or time-target awareness broad campaigns to manage spend (e.g., focus on key states or certain hours where target audiences search more). The key is to prevent the broad reach from overspending on low-value impressions. With careful targeting and negative keywords, broad match can be a strong awareness driver.
In summary, for Brand Awareness: Broad match is a favored tool to maximize reach in relevant categories, supported by phrase match when more control is needed. Exact match appears chiefly for brand terms or slogan-related keywords to ensure you’re present for those. Advertisers should track metrics like impressions, CTR, and any lift in direct traffic/brand query volume to gauge if the broad match awareness efforts are effective. And while conversions aren’t the primary goal, any that do occur are a bonus – broad match might unexpectedly bring some ready buyers even in an awareness campaign.
Lead Generation Campaigns
Goal: Acquire leads (sign-ups, form fills, inquiries) at a target cost per lead or within a budget, focusing on lead quality as well as quantity. Often relevant for B2B services, SaaS, education enrollments, etc., where a “conversion” is a lead rather than an immediate sale.
For lead gen, quality over sheer volume is usually a priority – a flood of low-quality leads can waste sales team time or budget. Therefore, match type strategy tends to be more conservative than for awareness. Phrase match and exact match are heavily used in lead gen campaigns to ensure relevance. You want your ads showing on queries that strongly indicate the searcher needs your service or product, and not so much on tangential research queries or curiosity clicks.
Exact match is particularly valuable for high-intent lead gen keywords. For example, a software company offering cybersecurity solutions will find that someone searching “cybersecurity software demo” or “enterprise network security provider [city]” is a highly qualified prospect – those would be great exact match keywords. By using exact, the company guarantees that their ads show for those exact searches, maximizing chances to capture that lead. As noted earlier, exact match yields higher conversion rates, which often means better cost per lead. If a lead gen advertiser has identified their “money keywords” (the search terms that consistently lead to qualified leads or deals), they will typically bid on those as exact match aggressively.
Phrase match plays a large role for lead gen as well, because it can catch mid-intent queries that still produce leads. For instance, consider a B2B marketing agency looking for leads. An exact match might be [B2B marketing agency NYC], but many potential clients might search “top B2B marketing companies” or “B2B marketing agency for tech industry” – those longer queries can be captured by a phrase match like “B2B marketing agency” or “B2B marketing” (with some refinement). Phrase allows you to engage users who are exploring or comparing options, not just those who type your exact offering. It balances volume with relevance – important if your exact-match list is limited and not generating enough leads. Many lead gen accounts use phrase match for most non-branded keywords, because it’s effective in filtering out very unrelated searches while still allowing some breadth to find interested prospects. As one Reddit PPC practitioner in B2B noted, they push back against broad match because even phrase sometimes “struggles to match to intent” in niche B2B SaaS contexts. That underscores how phrase is considered the loosest one would typically go for such specialized lead gen – broad might bring in totally irrelevant traffic, whereas phrase at least requires core terms to be present.
What about Broad match for lead gen? It can be a double-edged sword. On one hand, broad match can discover new search queries that your target audience uses (particularly if they use very varied language). It can also increase volume significantly, which might be needed if your exact and phrase keywords aren’t producing enough leads. On the other hand, broad can invite a lot of unqualified clicks – people slightly outside your target, or looking for information rather than to engage a provider. The key if using broad for lead gen is to pair it with Smart Bidding (like Target CPA) and ideally some measure of lead quality in your conversion tracking. Google’s AI can then try to optimize which broad queries actually lead to converted leads at your desired CPA. Indeed, Google’s own recommendation is that broad match with tCPA works well to find additional converting traffic. Real-world case: earlier we mentioned Meetic (an online dating company) using broad + Smart Bidding to boost sign-ups by 70% without breaking their CPA goals – this is essentially a lead gen example (they wanted user sign-ups). Another example from Google’s data: tails.com using broad to get 182% more sign-ups in a new market – that’s also lead generation for subscriptions. These success stories suggest that broad match can work for lead gen when the conditions are right (good conversion tracking, enough budget to let the algorithm learn, and presumably a wide enough target market).
However, many advertisers approach broad in lead gen with caution. A common tactic is to use broad match in a limited, exploratory capacity: e.g., run a separate broad-match campaign whose sole purpose is to gather search queries and additional volume, while the main campaigns rely on exact/phrase for efficiency. The broad campaign can have a controlled budget (maybe 10-20% of total spend) and aggressive negative keywords to filter obvious junk. The leads from this campaign can be evaluated – if they produce a few good leads at acceptable CPA, the campaign is justified; if not, one might pause it. It’s crucial to monitor quality: for instance, if broad match yields many leads but they all bounce or don’t convert to sales, it’s harming more than helping.
Scenario example: A company offering “cloud CRM software” might primarily use phrase match on “cloud CRM software” and exact match on variations like [cloud CRM] [CRM software cloud] [cloud CRM solution] etc. These ensure they get in front of users explicitly searching for cloud CRM solutions, likely good leads. Now, there might be potential customers searching “how to improve customer management” or “best sales tracking tool” which don’t explicitly say CRM – an exact or phrase strategy might miss those. A broad match on “CRM software” could snag those queries. If the company uses broad + tCPA, Google might detect that some of those broader queries (like “sales tracking tool”) actually lead to sign-ups on their site, and it will bid on them, whereas queries that lead to bounces (maybe “free CRM tutorials” or something) will be de-emphasized. Over time, broad could expand their lead pool. This is essentially trusting Google’s automation to find converting users beyond the obvious keywords.
Lead quality control: A big consideration in NA for lead gen (especially in B2B) is ensuring the leads are qualified (right job title, company size, etc.). Unfortunately, keyword match types alone can’t guarantee that – but they do influence it. Exact and phrase on very specific industry terms may yield more qualified leads (the person knew the jargon, etc.), whereas broad might pick up broader queries from less qualified folks. To manage this, lead gen advertisers often integrate qualification filters on landing pages or use scoring. But from the PPC side, they might add negatives like “beginner” or “what is” to broad campaigns to avoid very top-of-funnel queries. They might also use remarketing audiences or In-Market segments in combination with broad to try to pre-qualify who sees the ads.
In summary, for Lead Generation campaigns: The primary match types are usually Exact and Phrase to keep lead quality high and CPAs in check. Broad match can be utilized strategically – often with Smart Bidding – to supplement and find additional leads, but it requires careful oversight (and possibly a larger budget to be effective). A blended strategy could be: Start with exact/phrase on known high-intent keywords to get some baseline leads at a controlled CPA, then layer in broad match campaigns once you have conversion data to let Google intelligently expand. Always keep an eye on the lead quality coming from each match type and adjust accordingly (e.g., if broad leads are poor, tighten it up; if phrase isn’t capturing enough volume, consider adding more phrase variants or testing broad).
Direct Sales (E-Commerce) Campaigns
Goal: Drive online sales (transactions) with a focus on revenue and return on ad spend (ROAS). E-commerce advertisers want to sell products directly, often optimizing for cost per sale or ROAS targets.
In e-commerce, keyword match strategy often mirrors the purchase funnel: Exact match for highly specific, bottom-funnel searches (likely to purchase), Phrase match for slightly broader product category searches (researching or comparing options), and Broad match for prospecting and long-tail search discovery. The stakes in e-com are clear: wasted spend hurts profitability, but not reaching customers means missed revenue. North American e-commerce is very competitive (think of all the retailers bidding on popular product terms), so it’s about finding the right balance to maximize profitable sales.
Exact match in e-commerce: This is critical for high-intent, product-specific queries. These include searches for particular product names, SKUs, or very detailed queries like “buy Samsung Galaxy S21 128GB online”. If you carry those products, you want to capture those searches exactly – the user knows what they want, and they’re trying to buy it. Exact match ensures your ad shows and you can even tailor the ad to that product. Similarly, brand queries (if you sell a known brand) are valuable: e.g., a shoe retailer bidding on [Nike Air Max 270] exact – this catches a user looking for that model specifically (very likely to convert). Another category is queries with purchase intent words: [order custom birthday cake online] – an exact match on that ensures an ad with exactly that service. Exact match yields the best conversion rates here, so e-comm advertisers often prioritize exact for their best-selling products and high-ROI queries. One strategy many use is to funnel all brand+product queries into exact match campaigns with high bids, effectively owning the bottom of funnel. These often yield the highest ROAS. The downside, of course, is you only reach those who already know what they want.
Phrase match in e-commerce: Phrase is the workhorse for category and generic product searches. Shoppers often search more generally before deciding on a specific item. For example, “4K gaming monitor 27 inch” or “men’s waterproof hiking boots” – these are semi-specific but not a single product. Phrase match on “4K gaming monitor” or “waterproof hiking boots” would capture those queries (and similar ones like “best 27 inch 4K gaming monitor” or “women’s waterproof hiking boots” – though careful with gender difference, if you only sell men’s, you’d negative out “women’s”). Phrase match allows e-comm advertisers to appear for a variety of product searches that include the main keywords of the products they sell. It balances reaching broad product interest with filtering out completely unrelated stuff. For instance, phrase “hiking boots” will show for queries that include “hiking boots” (like “lightweight hiking boots for summer”) but not for something like “trail sneakers” that don’t use that phrase. Phrase is also useful for mid-funnel searches like comparison queries (“vs” searches), if the phrase is included. It might catch “Nike Air Max vs Adidas Ultraboost” if you phrase match “Nike Air Max” or “Adidas Ultraboost”. Covering those comparison searches can sway a buyer toward your product if your ad/message is compelling. Another advantage: phrase match can be used to cover many long-tail combinations without resorting to broad – which can help maintain a higher ROAS by not venturing too far off target.
Broad match in e-commerce: Broad match can be a powerful expansion tool for retailers, especially when combined with Target ROAS bidding. Google often touts that broad match with tROAS will find additional converting searches that you might miss. For example, someone might search in a very different way like “gift for runner marathon” – which doesn’t mention shoes, but if you sell running shoes, Google’s broad match might connect that query to your “running shoes” broad keyword because the intent (gift for a runner) could be satisfied by running shoes. Without broad, you would not have shown up for that query. If that person ends up buying, broad delivered a sale you otherwise wouldn’t get. Google shared a stat: advertisers who broaden exact to broad in tCPA saw 35% more conversions – likely many of those scenarios are e-commerce where broad match helped capture incremental sales. However, maintaining profitability is key. Broad match can sometimes spend on clicks that don’t convert (or that convert for low-value items, hurting ROAS). That’s why having a conversion value-based bidding strategy (like Target ROAS) is recommended; it will try to only bid on broad matches likely to yield good revenue relative to cost. The Optmyzr study indicated that while broad gave more volume, exact match still produced better ROAS in ~72% of accounts. So broad might raise sales but also ad spend, not always netting a better profit. The best approach might be: use broad match to supplement growth once your exact/phRase campaigns are efficient, and closely track performance metrics. If broad match in a campaign isn’t hitting the ROAS target, either refine it (through negatives or adjusting bidding) or consider pausing it.
A common tactic in e-commerce is to structure campaigns by match type. For example, create:
“Exact match” campaign for top products/queries (high priority in Shopping feed terms),
“Phrase match” campaign for category keywords,
“Broad match” campaign for exploratory keywords.
Budget can be allocated such that exact gets fed first (since those are your bread-and-butter conversions), phrase second, and broad last. Also, negative keyword sculpting is used: for instance, add all exact keywords as negatives in the phrase campaign to force exact queries to be caught by the exact campaign only, and add all phrase-level terms as negatives in broad campaign to force broad to truly find new stuff, not take traffic the phrase campaign could get. This way each layer has its own role and you minimize internal overlap. Google’s systems do a form of this automatically via priority rules, but many advertisers like the control of explicitly structuring it.
Real-world usage: A large online retailer in North America might share some insights. For example, an analysis by Optmyzr showed that broad match can indeed find cheaper clicks for e-commerce, but those clicks had lower conversion rates – in their data, 56% of accounts had lower CPC on exact match, meaning 44% saw lower CPC on broad (broad sometimes found less competitive auctions). But conversion rate was usually lower with broad, so net-net exact delivered better CPA/ROAS for most. Nonetheless, a significant minority of accounts (about 27%) did see better ROAS from broad – likely those are cases where broad match with good bidding found pockets of high-converting traffic that the advertiser’s keywords didn’t cover. If you’re an e-com advertiser, you want to test if yours is such a case. Some advertisers have publicly shared wins: e.g., one Reddit commenter mentioned after hesitating, they went heavily to exact match in a big e-com account and “it’s crushing” results, implying broad was not needed. Another said broad match “driving more conversions for cheaper” in a DTC experiment. The mixed experiences indicate the results can vary by industry, account structure, and how well Smart Bidding is tuned.
Using match types for specific product goals:
For new product launches (where you don’t have historical data), you might start with phrase match on the product category to get traffic, plus broad match to gather intel on how people search for it. As data comes in, you add exact matches for any frequent converting terms.
For high-margin or priority products, you ensure you’re there on all relevant searches via exact and phrase, and maybe limit broad if ROAS must be tightly controlled.
For clearance or low-competition products, broad could be an efficient way to scoop up bargain traffic as you might not care if it’s super targeted, any sale helps clear stock (just an idea; though typically you’d still want targeted traffic to sell even clearance items).
Holiday or seasonal campaigns: broad match might catch trending searches (like “gift for 10 year old boy” could match broad “toys” for a toy retailer) that you didn’t explicitly add. E-com advertisers often rely on broad more during Q4 peak to absorb surges in weird gift searches.
In summary, for Direct Sales (E-Commerce): Exact match is indispensable for capturing bottom-of-funnel purchasers (and protecting brand/product terms) to ensure high conversion rates and ROAS. Phrase match covers the mid-funnel shoppers looking by category or attributes, providing a solid balance of volume and efficiency. Broad match serves as the expansion lever – it can significantly increase reach and find new profitable sales, but it needs to be used with smart bidding and close monitoring to maintain profitability. A strategic layered approach, often called a “tiered match type strategy” (broad for discovery, phrase and exact for proven performers), is commonly recommended. Each match type plays its role in guiding customers from initial search to final purchase in the competitive North American e-commerce landscape.
Strategic Use of Match Types by Budget Size
Another critical factor in match type strategy is your advertising budget. A small local business with a few hundred dollars a month cannot approach match types the same way a nationwide brand with millions in ad spend can. Here’s how match type usage typically varies by budget level:
Small Budgets (Limited Spend): When budgets are tight, efficiency is paramount. Every click needs to count. Therefore, small-budget advertisers tend to rely heavily on Exact match, and to a lesser extent Phrase match, while using Broad match sparingly (if at all). Exact match ensures the little budget you have is spent on the most relevant searches, yielding the highest conversion probability. As Impact Group Marketing advises, exact match is perfect when “your budget is tight” because it focuses on only the most relevant traffic, conserving spend. Phrase match can supplement to capture some additional relevant traffic without straying too far. Broad match, by contrast, is often seen as a “money drainer for small businesses” if not managed well. With limited funds, you don’t have the luxury of paying for many experimental or low-intent clicks. One PPC expert on Reddit commented: “I’d agree with broad match keywords being a money drainer for small businesses. I use mostly phrase match… which still generate plenty of new variants … without giving too many irrelevant searches after adding negatives.” This reflects a common small-budget approach: start with phrase (and exact for the very top terms), gather any necessary negatives early on, and hold off on broad until you’ve maxed out the other types. Another practitioner noted that you should expand to broad only after you’re getting 75%+ of impressions on your exact/phrase terms and ROI is solid – and even then, only if you can handle the extra spend and management of negatives that broad requires. In essence, small advertisers should prioritize control and ROI: use exact for highest intent, phrase for slightly broader but still relevant traffic, and leave broad either for a later testing phase or avoid it entirely until you have more breathing room. If a small-budget advertiser does test broad, it should be with low bids or a strict experiment budget, and ideally with Target CPA to prevent runaway costs. It’s also smart to geographically or time restrict broad keywords in this scenario (e.g., only run them in your city or only during business hours) to contain spend.
Medium Budgets (Moderate Spend): With a moderate budget, you have some room to explore while still needing cost-effectiveness. This often calls for a mix of match types. Phrase match often becomes the backbone for medium budgets – it provides a steady flow of relevant traffic without the extreme narrowness of exact. Phrase match is considered a “budget-friendly option” because it limits many irrelevant clicks while still expanding reach moderately. So an advertiser with, say, a few thousand dollars a month might run mostly phrase match keywords for their core terms. Exact match is still used for the highest-value keywords (especially if you notice certain queries converting a lot – funneling those into exact can improve efficiency). But you might not want to maintain an enormous list of exacts if it’s not necessary; instead, exact could cover your top 10-20% keywords that drive most of your sales/leads, and phrase covers the rest of the relevant long-tail. With some budget flexibility, Broad match can start entering the picture as a controlled tactic. You might allocate a portion of spend to broad keywords in areas where you want growth or have seen success. Importantly, you’ll implement broad with safeguards: use broad only in campaigns with conversion tracking + smart bidding, and keep an eye on CPA/ROAS. For example, a medium-sized online retailer might use phrase match for most product categories, exact for their top products, and then test broad match on a few categories where they want to expand, using tROAS bidding to see if broad can net new sales efficiently. They wouldn’t unleash broad on all keywords at once, but incrementally. Another example: a B2B service company with moderate budget might primarily use phrase match for all their service keywords across many regions, but they may add a broad match campaign targeting a few niche services to see if they can tap into additional demand (with careful monitoring). The key at this budget level is balance – you can’t afford to waste too much, but you can’t stay too limited either if you want to grow. Many will find phrase match strikes that balance, and broad is used selectively as an expansion lever when metrics allow. Also, medium-budget advertisers should aggressively use negative keywords and optimization routines to make sure neither phrase nor broad spend on obvious waste. They have enough data to refine targeting, unlike small budgets which might not get statistically significant data quickly.
Large Budgets (High Spend): Large advertisers (from tens of thousands to millions in annual spend) have the ability – and often the necessity – to use all match types at scale. At high spend levels, the priority is often scaling volume while maintaining efficiency thresholds. Here, Broad match becomes much more prominent. Large-scale campaigns often embrace broad match (especially with Google’s encouragement and AI improvements) because once you’ve saturated the market with exact and phrase, broad is how you continue to grow. In fact, broad match is sometimes the only way to reach certain users or queries at massive scale. Google even made broad match the default for campaigns using Smart Bidding, acknowledging that big advertisers leaning on automation should start broad. The pros of broad – reach, less manual work, discovery – align well with large campaigns. Large accounts also typically have a lot of conversion data to feed Google’s algorithms, making broad match + smart bidding more effective. For instance, if an enterprise e-commerce company has thousands of conversions per month, Google’s AI can relatively quickly learn which broad match queries tend to convert and which don’t, thereby optimizing bids. That reduces the risk that a smaller advertiser (with sparse data) would face using broad.
That said, large budget does not mean being careless. Exact and Phrase match remain crucial even for big advertisers, but their role may shift slightly. Often, large advertisers use exact match for campaigns that require strict control – e.g., a promotional campaign on specific products, where they only want to spend budget on those product terms. Or for brand campaigns – even with a huge budget, you’ll use exact match on your brand to ensure you dominate it (and likely set Target Impression Share to near 100%). Phrase match is used for the bulk of mid-tier keywords where broad might be too risky and exact might be too sparse. One can think of a pyramid: broad match covers the wide top (casting very wide), phrase the middle, and exact the tip of the pyramid (most precise).
A large-budget account likely has campaigns at each level of that pyramid. They might even separate campaigns by match type and funnel stage, as discussed earlier, to control spend allocation. One real example: an account spending $1M+/month in a competitive vertical (like the one on Reddit handling legal and healthcare) found success with 95% exact match – which is slightly contrary to what one might expect, but it shows that even with large budget, some choose to stay strict for ROI reasons. However, that is likely an outlier or very strategy-specific (legal keywords are so expensive that broad could be ruinous; they chose to put big money only on proven exact terms).
In many other cases, big advertisers do incorporate broad significantly. Google shared that as of 2023, many large advertisers saw positive results adding broad: e.g., some saw +35% conversions by expanding to broad with tCPA. Large retail accounts often report that broad match combined with tROAS helped them capture incremental revenue once they maxed out exact/phrase.
Another advantage large budgets have: they can afford to test and iterate. With more money, a big advertiser might run simultaneous experiments – one campaign using phrase/exact only, another adding broad – and see the outcome. They might dedicate a portion of budget specifically for discovery via broad match, fully expecting some waste but valuing the insights and extra reach gained. They also typically have the resources (people or tools) to manage the influx of data from broad campaigns (lots of search term analysis, etc.). Smaller advertisers might be overwhelmed by that or not have time.
In summary, budget size influences how aggressive you can be with match types:
Small budgets: stick to Exact/Phrase for high efficiency; broad only carefully if at all.
Medium budgets: use Phrase as a core with some Exact for key terms; experiment with Broad in a limited, optimized way when ready.
Large budgets: leverage Broad Match + automation to scale up, while still employing Exact and Phrase for control where needed. Broad can even become the primary driver in smart-bidding campaigns, with exact/phrase ensuring you don’t lose focus on the known performers.
A useful rule of thumb cited in an industry blog: “Your budget can guide match type choice – if your budget is flexible (large), you can afford broad match’s wider net; if your budget is moderate, phrase match offers controlled growth; if your budget is tight, exact match makes sure each click is worth it.” This encapsulates the approach at each level.
Pros and Cons Summary
To crystallize the analysis, here is a concise rundown of the key pros and cons of each match type and their best use cases:
Broad Match:
Pros: Widest reach; finds new queries and audiences. Saves time on keyword list building. Leverages Google’s AI fully for intent matching, and works well with Smart Bidding to maximize conversions within goals. Can lower CPC by entering less competitive auctions. Ideal for top-of-funnel campaigns, discovery, and when you need to scale up impressions.
Cons: Least precise; can match to irrelevant searches, causing wasted spend if unchecked. Typically lower CTR and conversion rates compared to other types. Requires extensive use of negative keywords and monitoring. Offers less control over who sees your ads (could dilute message or brand if ads appear on odd queries). Not recommended for very small budgets or for highly sensitive targeting without sufficient data.
Use Best For: Large campaigns with conversion tracking and flexible budget, exploratory phases of campaigns, brands seeking maximum awareness, and advertisers leveraging automated bidding to reach additional relevant traffic. Also useful when you’ve exhausted growth from exact/phrase and need more volume. Broad match is a strategic tool for reach, to be balanced with other types.
Phrase Match:
Pros: Good balance of reach and relevance. Ensures the query includes the keyword (maintains context/intent) for more qualified traffic than broad. Higher relevance leads to better CTR and conversion rates than broad in most cases. Reduces need for exhaustive keyword lists by covering variations around a phrase. More budget-friendly in terms of controlling spend than broad. Ideal for mid-funnel targeting – capturing people who know roughly what they want but are open to options. Easier to optimize since queries contain known phrases (making negative and ad copy strategies simpler).
Cons: Still can show on queries that contain the phrase but differ in intent (so some irrelevant clicks possible). Doesn’t reach queries that don’t share the phrasing, potentially missing some traffic that broad would catch. Might require multiple phrase keywords to cover synonyms or related concepts (not as set-and-forget as broad). Performance, while strong, might not achieve the extreme efficiency of exact on a per-click basis, nor the extreme reach of broad – it’s a middle ground by design.
Use Best For: Most general campaigns where a balance is needed – medium budget campaigns across industries often center on phrase match. Great for lead generation where you want to filter out very unrelated traffic but still get enough leads. Useful for e-commerce category keywords and service queries that have common phrasing. It’s often the default choice for new campaigns if one is cautious about broad: start with phrase to get data, then adjust. Phrase match is a reliable, controlled-growth match type suitable for advertisers who want to expand beyond exact but not jump straight to broad.
Exact Match:
Pros: Highest control and precision. Ads only show on searches nearly identical in intent to your keyword, yielding highly relevant clicks. Usually the highest CTR and conversion probability – great for maximizing ROI and achieving low CPA/high ROAS on those terms. Prevents spending on anything outside your targeted queries, which protects budget. Essential for capturing the most valuable bottom-of-funnel searches (people ready to act) and for protecting brand terms. Simplifies ad message alignment (know exactly what user searched). Provides clear data per keyword for analysis.
Cons: Limited reach – won’t find new customers outside the exact queries. Relies on you knowing which keywords to bid on; you can miss out on traffic if you don’t have those keywords. Hard to scale campaigns with only exact match (diminishing returns once all key terms covered). Can require a large list of keywords to cover many variations, which increases management complexity. Some loss of control recently with “close variants” potentially matching things you didn’t intend (though usually minor). Highly competitive exact terms can have expensive CPCs due to many bidders. Not ideal for initial awareness or discovery since it’s so focused.
Use Best For: Small budgets or anyone needing cost-efficiency – exact will concentrate spend on the best prospects. High-value keywords that are proven converters – use exact to make sure you appear for those and can bid appropriately. Brand keywords – to ensure you dominate your own brand searches. Competitive industries where irrelevant clicks are very costly – exact helps avoid those. Also for campaigns with strict targeting criteria or regulatory concerns (you only want to show on certain phrases to avoid issues). In summary, exact match is the go-to for maximizing relevance and conversion rate, and it’s often the foundation of a high-ROI search strategy, supplemented by phrase and broad to capture everything else.
To illustrate the interplay: A common best practice is to use all three in a layered approach – Exact for precision, Phrase for expansion with control, Broad for maximal reach with automation. As one source summarized, each has its role: “Broad Match is for reach and discovery; Phrase Match helps maintain relevance with some flexibility; Exact Match maximizes control and ensures your budget goes toward highly relevant clicks.”. Advertisers who master when and how to use each match type – and in what proportion – are best positioned to achieve strong results in their Google Ads campaigns.
Conclusion
In 2025, the use of keyword match types in Google Search Ads has become both more fluid and more critical. Google’s advancements in AI and intent mapping have made Broad Match far more viable than it was years ago, to the point that Google is confidently pushing it as a default for many advertisers. Broad match can unlock new scale and perform impressively – especially when paired with Smart Bidding – as evidenced by case studies (e.g. +70% conversions for Meetic, +35% conversions in Google’s tCPA experiments). However, broad match still requires a skilled hand on the wheel: careful planning, negative keywords, sufficient budget, and vigilant optimization to avoid waste. It is a powerful tool, but not a panacea.
Phrase Match remains a dependable middle option, valued across industries for its ability to widen reach beyond exact while retaining much of the intent relevance. It fits well with moderate goals – whether it’s balancing volume and CPA for lead gen, or capturing diverse product queries for retail – and continues to be a staple in many PPC strategies. With the 2021 update aligning phrase with the old modified broad logic, phrase match has effectively taken on the role of a “controlled broad” – giving advertisers confidence that as long as the user’s search includes the core phrase, their ad can show. Its best practices (monitoring queries, using it for key mid-level terms, etc.) ensure it drives quality traffic at scale.
Exact Match is still the sharpest arrow in the quiver for PPC managers focusing on efficiency. Despite Google expanding its latitude with close variants, exact match is how you laser-target those searches that matter most. The data and expert opinions consistently highlight that exact match keywords deliver superior CTR, conversion rates, and often ROI in the majority of accounts. The trade-off is coverage – you simply cannot rely only on exact if growth is a goal, especially with the dynamic nature of search language. But as a foundation, exact match keywords are indispensable for capturing and converting high-intent prospects. Many successful campaigns (particularly in North America’s competitive markets) start by nailing their exact match strategy – ensuring every dollar is well-spent – and then layer on phrase and broad to expand.
All Industries, All Goals: While the specific examples differ (a law firm might use exact match almost exclusively for “emergency injury lawyer” queries, whereas an e-commerce brand might leverage broad match to find new product search trends), the underlying principles of match type usage are consistent across industries. You adjust the dials (broad vs phrase vs exact) based on whether you need more reach or more precision. For brand awareness, you turn the dial more toward broad – accept a bit more spillage for the sake of visibility. For lead generation, you lean toward phrase/exact – prioritize qualified clicks and manageable CPAs, introducing broad carefully when you want to scale. For direct sales, you use an “all of the above” approach: exact for converting keywords, phrase for general shopping queries, broad to find new customers – all while keeping ROI in check.
North American Focus: In the U.S. and Canada, where search volumes are high and competition is intense, these strategies are especially important. Broad match in the U.S. can open the floodgates to enormous traffic, so American advertisers are often a bit cautious – they frequently start with phrase/exact until they see broad can meet their CPA/ROAS goals. On the flip side, U.S. advertisers also stand to gain tremendously from broad if done right, because the market is so large (there are more “hidden” queries to uncover). The data and case studies referenced (Optmyzr’s 2,600 account study, Google’s broad match highlights, agency guides, etc.) largely draw from North American or global campaigns, so the insights are highly relevant to NA advertisers.
As a final note, it’s worth acknowledging an industry sentiment: Some experts speculate that Google might eventually unify or eliminate match types, effectively making all keywords “broad” with AI handling the rest. Already we see the lines blurring – exact isn’t exact, phrase is smarter, broad is more precise than before. Whether that happens or not, for now in 2025, savvy advertisers use match types as levers to control their campaign outcomes. By understanding the strengths and weaknesses of Broad, Phrase, and Exact match and aligning them with campaign goals and budgets, advertisers can maximize their Google Ads performance – driving reach when needed, ensuring relevance when it counts, and ultimately achieving a strong return on their advertising investment.
Sources:
Google Ads Help Center – Keyword Matching Options & Broad Match Guidance
Think with Google – Advances in Broad Match and Search Intent
Google Ads (Business Blog) – Using Broad Match with Smart Bidding (Case Studies)
Optmyzr PPC Study – Broad vs Exact Match Performance Analysis
Reddit r/PPC Community – Anecdotal insights from practitioners (broad vs exact experiences)
Citations
How to Use Broad Match and AI-Powered Advertising – Google Ads
About the broad match keywords campaign setting – Google Ads Help
Is Broad match still Viable to use in Google ads for Small businesses? : r/PPC