Subscribe to our Blogs

    Marketing Team

    The AOK Marketing Team is a diverse group of amazing individuals driven to help all of our clients succeed. Great people are everywhere, and we believe that people should control their workday, their work environment, and where they live. We have team members in 9 countries: United States, Canada, Egypt, Belgium, Ireland, Australia, India, Pakistan, and Hong Kong. How can we help you?

    Blog Posts

    Infographic illustrating Click-Through Rate (CTR) definition, formula, industry benchmarks, and strategies to boost CTR

    May 10, 2025

    Marketing Team

    Introduction: In digital marketing, Click-Through Rate (CTR) is a make-or-break metric that gauges the effectiveness of your content and ads. Whenever you serve an impression – be it an ad, an email, or a search result – CTR tells you what percentage of people clicked through to learn more. It’s essentially a measure of how compelling your message is to your audience. This article will demystify CTR, explain why it’s so important across various channels (from Google Ads to email campaigns), share industry benchmarks, and provide actionable strategies to boost CTR and drive more engagement from your marketing efforts. What is Click-Through Rate (CTR)? 
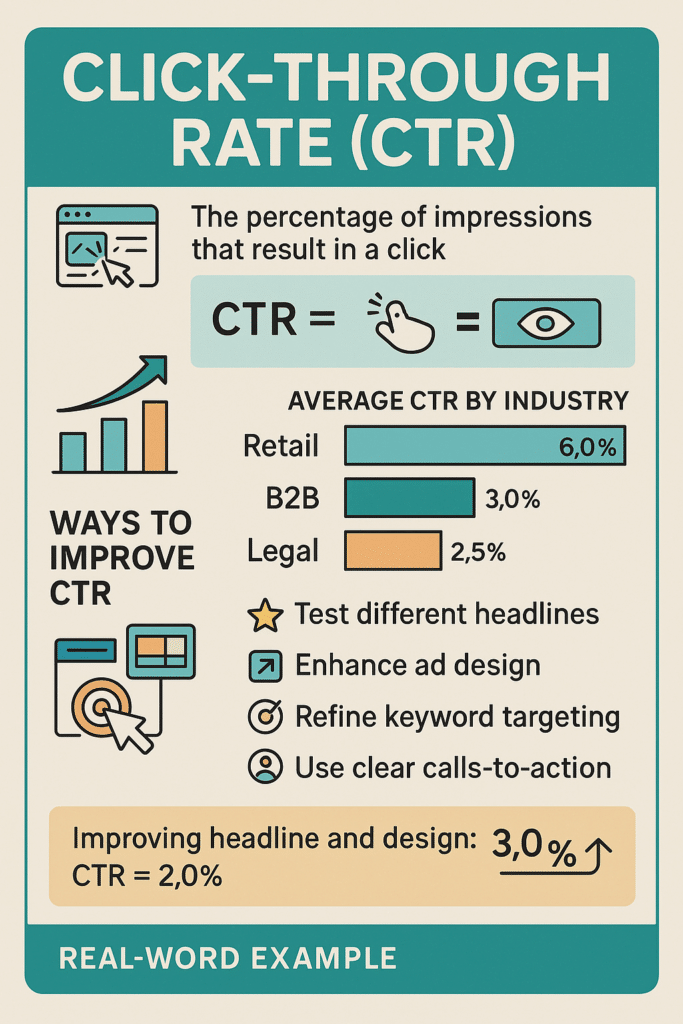
Click-Through Rate (CTR) is defined as the percentage of people who click on a link or call-to-action out of the total number who saw it (impressions). The formula is simple: CTR = Clicks / Impressions × 100% For example, if your Facebook ad was shown 1,000 times and 25 people clicked it, the CTR is 2.5%. If an email was delivered to 500 recipients and 50 clicked a link inside, that’s a 10% CTR. CTR can be calculated for ads, organic search results, email links, link CTAs on webpages – essentially any instance where an impression can lead to a click. CTR is usually expressed as a percentage. A higher CTR means a larger share of viewers are enticed enough to click, indicating your creative or message is resonating well. A low CTR might signal that your headline, copy, or offer isn’t appealing to the audience you’re reaching (or that you might be reaching the wrong audience altogether). Because of this, marketers treat CTR as a key indicator of engagement and relevance. It’s important to contextualize CTR by medium. A “good” CTR for one channel might be average or poor for another. For instance, a 2% CTR on a display ad could be considered decent (since display ads historically have low CTR), but a 2% CTR on a branded email might be underwhelming. We’ll delve into benchmarks next to give a clearer picture. Why CTR Matters Across Channels CTR is more than just a vanity metric – it has real implications for campaign performance and costs: Indicator of relevance and creative effectiveness: If a lot of people click your content, it means your message or offer is grabbing attention. High CTRs generally indicate that your ad copy, subject line, or title is effectively speaking to your audience’s needs or curiosities. Conversely, a low CTR often flags that something’s off – maybe the wording isn’t attractive, or the offer isn’t compelling enough, or you’re targeting an uninterested audience. 
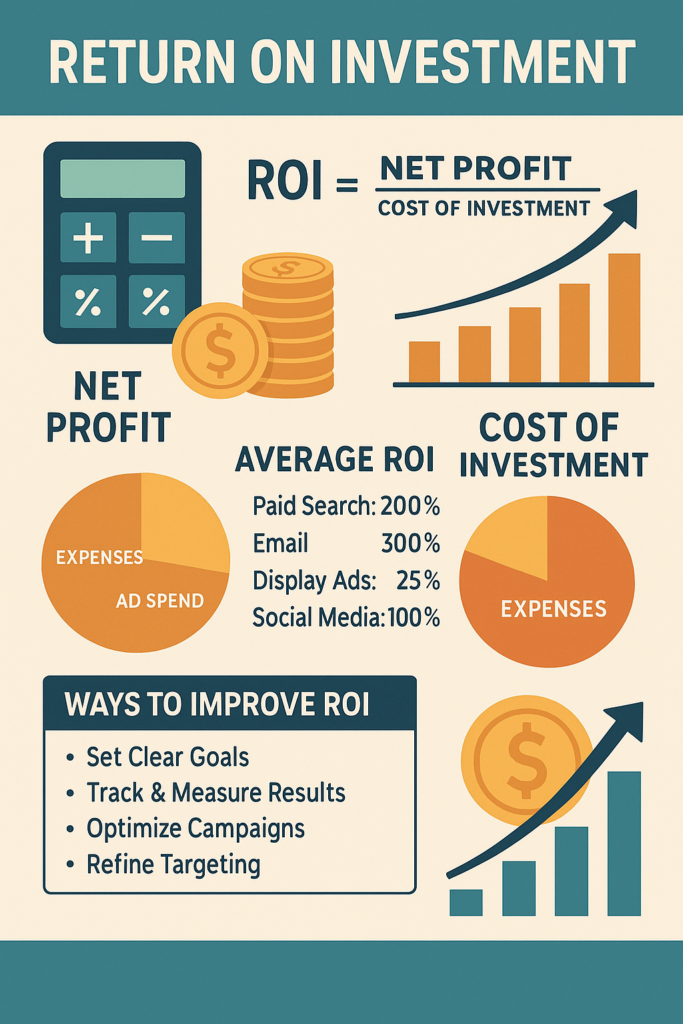
Quality Score and ad costs (PPC): On platforms like Google Ads, CTR plays a major role in Quality Score. Google rewards ads that get higher-than-average CTRs (because it means users find them useful) by giving them better positions and lower cost-per-click. In other words, a high CTR can lower your advertising costs. For example, effective optimization of PPC can yield a 200% ROI (i.e., $2 revenue per $1 spent) partly thanks to high CTRs and corresponding quality score. A low CTR ad, on the other hand, will often pay a premium or get limited exposure. So improving CTR isn’t just about more traffic – it directly saves you money in paid campaigns. Conversion pipeline: CTR is the first step towards conversion. If nobody clicks, nobody converts. For email campaigns, you first need a good open rate, but after that, CTR determines how many people actually visit your landing page or offer. A higher CTR means more visitors and hence more potential conversions downstream. It can also indicate that the traffic you’re getting is well-targeted, since they’re interested enough to click. Marketers closely watch CTR alongside conversion rate; if CTR is high but conversions are low, it signals a landing page or offer problem. If CTR is low to begin with, you have an awareness or messaging problem. Benchmark of competitiveness: In channels like search, your CTR relative to competitors can signal how appealing your result is. For instance, in Google’s organic search results, if your snippet (title + description) has a below-average CTR for its position, you might lose ranking over time to a competitor that gets more clicks. On social media, if your posts have a low CTR, algorithms might show them less. High CTR content often gains more visibility – it’s a virtuous cycle. In short, CTR is a reflection of how well you’re connecting with your audience’s intent or interest in that moment. A focus on CTR means a focus on relevance – ensuring the people who see your marketing find it compelling enough to engage further. CTR Benchmarks by Channel Let’s talk numbers: What constitutes a “good” click-through rate? It varies by channel and industry. Here are some recent benchmark figures to provide context: Search Ads (Google Search Network): Across all industries, the average CTR for paid search ads is around 6.4% in 2024. Search ads generally have the highest CTR of common digital ad types because they appear when someone is actively looking for something. However, CTR can range widely: 3-5% might be average in some industries, whereas top-performing search ads (especially branded keywords or highly targeted queries) can see CTRs of 10% or higher. An older WordStream study found an overall average of ~3.17% for search ads, but more recent data suggests higher engagement, possibly due to improved ad formats and targeting. Takeaway: If your Google Ads CTR is, say, 2% on core keywords, that’s below industry average – you likely have room to improve ad copy or keyword alignment. Display Ads (Google Display Network & programmatic): Display ads (banners on websites) notoriously have low CTRs. The average is around 0.5% or less. One analysis noted an average CTR of 0.46% for display across industries. Large banner blindness and broad targeting often contribute to this. Even a 1% CTR on display is considered strong. By country, there are slight variations (e.g., historically the U.S. average CTR for display was ~0.1% in some datasets, with certain formats like large rectangles doing better). Bottom line: Don’t be alarmed by sub-1% CTRs on display – it’s expected. However, you can still optimize through better creative (rich media, clear calls to action) and tighter targeting to improve on the baseline. Facebook and Instagram Ads: On Facebook, the overall average CTR for ads is about **0.9%**. That includes various formats. Specifically, Facebook News Feed ads tend to have higher CTR (around 1.1% on average), whereas right-column ads are much lower (~0.1% CTR). Facebook Story ads see about 0.8% CTR. Instagram, being a highly visual platform, often has slightly lower CTR on feed ads (around 0.2–0.3% on average), because users scroll quickly through images. LinkedIn ads also hover around 0.2% CTR (though LinkedIn’s cost per click is much higher, so CTR isn’t the only concern there). Twitter can sometimes yield 1-3% CTR for promoted tweets if well-targeted, though median might be closer to ~0.5% in many cases. Key point: Social ad CTRs vary by creative and audience; while ~1% is a general benchmark on Facebook, certain compelling ads can outperform that. If your social CTRs are below 0.5%, it may indicate your ad content or targeting needs adjustment. Organic Search (SEO): The click-through for your page when it appears in Google’s organic results will depend on your ranking position. Historically, the #1 organic result can get anywhere from 20-40% CTR, and being on page 1 (positions 1-10) is crucial. HubSpot found that across websites, the average SEO click-through rate (i.e., percentage of search impressions that resulted in clicks) was 13% on average (median ~8%). This suggests that many pages seen in search results aren’t clicked (perhaps due to being lower on page or because of searchers refining queries). But pushing your way up the ranks has big payoffs – for example, a study of millions of Google results showed that moving from the #2 to #1 position can increase CTR by over **30%**. For your own site, you can check Google Search Console which shows the CTR for each query your site ranks for. Use that to identify where you could improve titles/meta descriptions to capture more clicks (if your CTR is lower than expected for the position you hold). Email Marketing: Email CTR is typically measured as clicks divided by delivered emails (or sometimes clicks out of opens, which is called click-to-open rate – a different metric). A good email CTR (per delivered) often falls in the 2% to 5% range. This can vary by industry: for instance, tech/software emails might average ~2-3%, while media/newsletters could see higher if content is very engaging. According to MailerLite’s data, the overall median email click rate is about 2.00% across industries. Some industries do better (up to ~4% average in sectors like hobbies or nonprofits) and some worse (around 0.8–1% in industries like e-commerce or publishing with frequent emails). If your email campaign delivered to 10,000 people gets 300 clicks, that’s a 3% CTR – a solid performance in many cases. But if it got only 30 clicks (0.3%), that’s a red flag that either the list targeting, the email content, or the call-to-action needs work. Other Channels: For completeness, other forms of CTR might include YouTube video ad CTRs (often ~0.5% for display ads, and view rates instead of CTR for skippable video ads), CTRs on call-to-action buttons on webpages, etc. The same principle applies: measure the percentage of users who take the next step when presented with an opportunity. Each channel will have its norms. For example, a CTA button on a dedicated landing page might have a 10-20% CTR if well-designed and the audience is warm, whereas a generic homepage banner might be under 1%. These benchmarks are not static – they change with consumer behavior and platform changes. For instance, average Facebook CTR slightly increased to 2.53% in lead-gen campaigns in 2024, up from 2.50% (possibly due to better ad targeting tools). Always look for the most recent data for your industry if available. The above gives a broad sense: search > social > display, and specific contexts like email or organic search have their own baselines. How to Improve Your CTR: Channel-Specific Strategies Improving CTR involves making your audience an offer (in copy or visuals) that they can’t resist clicking. Here are strategies broken down by context: For Search Ads (Google/Bing): Refine your keywords: Ensure you’re bidding on highly relevant keywords. If your ad is showing for queries that don’t match user intent, people won’t click. Use negative keywords to filter out mismatches. For example, if you sell B2B software, you might exclude terms like “free software” or “software tutorial” if those searchers aren’t looking to buy. Also, focus on keywords with clear intent. Long-tail, specific keywords might have lower volume but higher intent (e.g., “CRM software for insurance companies demo” could convert better than “CRM software” generic term). Write compelling ad copy: The headline is critical – include the keyword (to show relevance) and a strong benefit or call-to-action. For example, instead of “Cloud Storage Solutions – AcmeCorp”, say “Secure Cloud Storage – 1st 50GB Free”. Use Title Case and consider adding a number or symbol to stand out. The description should address a pain point or offer value. Highlight things like “Free Trial”, “24/7 Support”, or an emotional trigger depending on what appeals. Ads with emotional or urgent language can draw higher CTRs, especially if competitors have bland copy. Utilize ad extensions: Extensions (sitelinks, callouts, structured snippets, etc.) make your ad larger and more eye-catching, and offer additional links for users to click. This not only improves overall CTR by providing more opportunities for engagement, but can also increase credibility. For example, adding sitelink extensions (like “Pricing”, “Features”, “Case Studies”) can increase CTR by giving users direct pathways to what they care about. Google reports that ads with multiple extensions often see higher CTR than those without. Test multiple ad variants: Run A/B tests (or use responsive search ads which automatically test combinations) to see which headlines or descriptions yield the best CTR. Sometimes a small copy tweak – e.g., phrasing “Try it free” vs “Start your free trial” – can lift CTR noticeably. Continuous testing is key; even after achieving a good CTR, keep experimenting to potentially do better. Leverage dynamic features: For example, Dynamic Keyword Insertion (DKI) can automatically insert the user’s search query into your ad headline, making it ultra-relevant (just use carefully to avoid awkward phrasing). Similarly, countdown timers in ads can create urgency (“Sale ends in 2 days!”) which can boost CTR if appropriate. For Display Ads: Use eye-catching visuals: Banner ads need to grab attention in a split second. Use high-contrast colors, bold text, and imagery that stands out from the host page. Faces or human figures can draw the eye. Ensure the design isn’t too cluttered; a clear focal point (like your product or an offer text) helps. Strong call-to-action on the ad: Because people aren’t actively seeking your content when browsing, the ad needs to clearly invite the click. Phrases like “Learn More”, “Get 50% Off Today”, “Download Free Guide” on a button graphic can improve CTR. Make sure the value proposition is stated – e.g., “Save 20% – Shop Now” entices more than just “Shop Now”. Behavioral targeting: Show your ads to the most relevant audience. Using remarketing (retargeting) often yields CTRs many times higher than cold prospecting ads, because the audience has already interacted with your brand. Retargeted ads can see CTRs 10x higher than normal display in some cases, since you’re reaching warm prospects. Likewise, using in-market or affinity audience targeting (people whose interests align closely with your product) will likely improve CTR relative to broad demographic targeting. Appropriate formats and placement: Certain ad sizes and placements perform better. For instance, medium rectangle (300×250) and large rectangle (336×280) and leaderboard (728×90) are known to often get better CTR than small banner sizes. Also consider newer formats like responsive display ads, which adjust to fit and often “blend” into content in a native-like way, potentially encouraging clicks. Some early reports suggest Google’s responsive display ads can outperform traditional banners in CTR. Frequency capping: If the same users see your ad too often, they’ll tune it out (and might even develop banner blindness towards it). By capping impressions per user (e.g., no more than 3-5 times per day), you can prevent fatigue and focus on fresh eyes – maintaining a healthier CTR. For Social Media Ads (Facebook/Instagram/LinkedIn/etc.): Nail the audience targeting: Social platforms offer granular targeting – use it. If you target a very broad audience, your CTR may suffer because many people seeing the ad aren’t in-market. Create audience personas and use interests, demographics, or lookalike audiences to hone in on those most likely to care. For example, if selling a fitness app, target people interested in specific fitness activities or brands rather than all “health & wellness”. The more relevant the audience, the higher the likelihood they’ll click. Compelling visuals or video: Social feeds are crowded, so your creative must stop the scroll. Use bright, contrasting imagery or short videos/gifs that capture attention in the first 1-2 seconds. Videos can be very effective – short-form videos are the leading format many marketers plan to invest in because they drive high engagement (21% of marketers say short videos deliver the highest ROI and presumably strong CTR). Ensure any text on the image is readable on mobile and adheres to platform guidelines. Showing a person using your product, or an aspirational outcome, can often outperform generic graphics. Text that sparks curiosity or speaks to a need: Your ad’s headline and body text should either pose an intriguing question, highlight a benefit, or call out a pain point. For instance: “Struggling with X? Discover how to solve it” or “Increase Your Y by 50% – See How”. On Facebook, the first line of the ad text may be all someone reads before deciding to click “…See More” or not. Make that first line count (e.g., lead with a bold statement or stat: “54% of marketers struggle with lead conversion. Here’s a solution.”). Also, keep it concise – while you have space for longer text, oftentimes shorter ads (one short sentence headline, one-line body) can perform better by cutting straight to the point. Call-to-action buttons: Use the platform’s CTA button options (e.g., “Learn More”, “Sign Up”, “Shop Now”). They’re there for a reason – a clear CTA button can lift CTR by making it obvious what action to take. Choose the CTA text that matches your goal: “Learn More” for informational content, “Download” for an eBook, “Sign Up” for a webinar, etc. This sets user expectations and draws those genuinely interested. Social proof and urgency: If applicable, mention numbers or social proof in the ad (e.g., “Join 5,000+ marketers using this tool” or “Limited spots – 2 days left to register”). An A/B test might find that including such elements improves CTR. However, make sure it’s credible; authenticity is key on social. Also, ensure any urgency (like deadlines) is genuine and not overused, or it can lose effectiveness. Continuous refresh: Creative fatigue happens faster on social. Users might see your ad multiple times within a week, and performance can drop. Monitor your frequency and CTR over time. If CTR starts to decline, refresh the creative – swap in a new image or tweak the copy. Even high-performing ads may need a refresh every few weeks to maintain engagement. For Email Campaigns: Optimize the subject line (for opens): While subject line affects open rate more than CTR, it’s the first step – if nobody opens, nobody clicks. Use personalization if possible (first name, etc.), and make the subject enticing but not misleading. Subjects that imply a benefit or spark curiosity (“Your Exclusive 20% Discount Inside” or “How [Competitor] Got 1000 Leads in a Month”) can drive higher open rates, thereby giving you more chances for clicks. Compelling email content and design: Once opened, the email content itself must drive the click. Keep your email copy concise and scannable. People often skim emails, so use headings, bullet points, and bold text on key offers. Communicate the value of clicking: instead of a generic “Learn More” link, frame it as “Download your free guide” or “View my personalized report”. This lets the reader know exactly what they’ll get by clicking. Multiple links/CTAs: Don’t rely on a single link at the bottom. In a longer newsletter, include hyperlink text in the intro that teases the content, maybe an image thumbnail that’s clickable, and a formal CTA button. Some readers will click mid-way through reading if interested. Also, make images clickable (and add descriptive alt text), as many users instinctively click images. However, avoid too many different calls-to-action that might confuse the reader – ideally, keep the email focused on one primary action, repeated in a couple of places. Personalize and segment: The more tailored an email is, the higher the engagement. Segmentation means sending targeted content to different groups (e.g., one version of the email to customers, another to prospects, or different content based on past purchase or interest). Personalized emails – even something as simple as referencing the recipient’s industry or a recent interaction – can dramatically lift CTR. According to research, segmented campaigns can have significantly higher CTR because the content resonates more with the audience’s specific interests (some sources note click rates can be 50%+ higher in segmented vs. non-segmented sends). Mobile-friendly format: A large portion of email is opened on mobile devices. Ensure your email design uses a single-column layout and large, tappable buttons. If an email is hard to read or interact with on a phone, people won’t click. Test your emails on mobile – does the CTA button show up without scrolling? Is the text readable without pinch-zooming? Optimizing for mobile can salvage clicks that would otherwise be lost due to poor experience. A/B test email elements: Just like with ads, test different variations. You can A/B test the email content – for example, one version with a blue CTA button vs. one with a red button, or different wording (“Get the Guide” vs “Download Now”). Or test different email lengths – sometimes a shorter email that only teases content can prompt more clicks than a long email that gives away too much. Track which version yields a higher CTR and iterate accordingly. For Organic Search (SEO) Listings: Improve meta titles and descriptions: Even though Google sometimes rewrites snippets, usually your meta title is shown as the headline in search results. Make it punchy and relevant. Include the keyword towards the front, and consider adding a call or value prop: e.g., “Buy Organic Coffee Beans – Free Shipping on $50+ Orders”. For meta descriptions, you have ~150 characters to persuade the searcher that your result satisfies their intent. Use this space to address the query directly and include a call-to-action or incentive (“Browse 20+ flavors of organic, fair-trade coffee. Find your new favorite – shop now.”). While meta descriptions don’t directly affect ranking, they do affect CTR, and a higher CTR can indirectly improve your rankings over time if Google sees users prefer your result. Use rich snippets/schema: Where possible, implement structured data (schema markup) on your site to enable rich snippets like star ratings, product prices, FAQ dropdowns, etc., in search results. Rich snippets make your listing more prominent and informative, which often boosts CTR. For example, a page with a review star rating might draw the eye more than those without. An FAQ snippet below your result can occupy more screen space (good for visibility) and directly answer some questions – possibly enticing clicks from users who want more details. Target featured snippets: If you structure your content well (clear headings, concise answers), Google might feature it in a coveted “position zero” snippet for certain queries. Getting a featured snippet often dramatically increases CTR because your content is highlighted at the top. Keep in mind, sometimes featured snippets answer the query so well that users don’t click (zero-click searches), but often, especially for how-to or list snippets, users click through for the full context. Optimize for snippets by directly answering questions in your content (briefly) and then elaborating – this way Google can grab the quick answer, and the user will click for the deeper info. Rank higher for high-intent terms: This might go without saying, but improving your actual rankings is the surest way to improve CTR in organic search. The top result gets a much higher CTR than results down the page. If you’re currently rank #5 for a valuable query, that might net maybe ~5% of clicks, whereas rank #1 could get 20%+. Through on-page SEO and link building, moving up the ranks will directly yield more clicks. Keep an eye on Search Console for pages that have a high average position but low CTR – that may mean the snippet isn’t effective. Conversely, pages with decent CTR but low position are doing well snippet-wise; focus SEO efforts to elevate those pages’ positions, as they could capture significantly more traffic if they rank higher. General Tactics (applicable to multiple channels): Use urgency and FOMO wisely: Limited-time offers, countdowns, or language like “Don’t miss out” can prompt clicks from people who don’t want to lose an opportunity. This can be effective in emails (“Sale ends tonight – shop now”) or ads (“Last chance to register”). Be truthful and don’t overuse urgency (constant false alarms can train audiences to ignore you), but for genuine limited offers, highlighting urgency can lift CTR. Leverage curiosity (the curiosity gap): Phrasing that piques interest without giving everything away can drive clicks. Blog titles and social posts often use this technique: e.g., “We analyzed 100 websites – here’s what we found” or “The secret to X might surprise you”. The reader has to click to satisfy their curiosity. Just ensure the content pays off the curiosity – otherwise it’s clickbait that can backfire with high bounce rates or user frustration. Benefit-focused messaging: Always frame your link text or ad copy around benefits to the user. Instead of “Our Product Features Advanced AI”, say “Save 5 Hours a Week with AI-Powered Assistance”. When people see a benefit that aligns with their needs, they’re far more likely to click. Review your low-CTR items and see if you’re talking about features (boring) versus benefits (compelling). Test, test, test: It’s worth reiterating that continuous testing is key to improving CTR in any channel. Run experiments, gather data, and implement the winners. Even seasoned marketers are sometimes surprised by which messaging resonates best – let the users’ click behavior tell you what they find most engaging. The Bigger Picture: Balancing CTR with Other Metrics While a high CTR is generally positive, it’s not the only goal. It’s important to ensure that the pursuit of clicks aligns with broader objectives: Relevance and conversion: Don’t use misleading tactics to boost CTR (e.g., a clickbait ad that isn’t relevant to your landing page). That might yield clicks, but those visitors will bounce and not convert, harming your conversion rates and potentially quality scores. It’s better to have slightly lower CTR but from an audience that truly cares, than a high CTR of unqualified visitors. Always align the message of your ad/email/link with what’s on the other side of the click. CTR vs. ROI: Sometimes, an ad with a moderate CTR can be more profitable than an ad with a high CTR if the former targets a more qualified audience. For instance, a flashy ad might attract lots of curiosity clicks (high CTR) but few buyers, while a more specific ad draws fewer clicks but from people ready to purchase. Keep an eye on metrics like conversion rate and cost per conversion alongside CTR. The ultimate goal is not just clicks, but meaningful engagement and results (leads, sales, etc.). Platform nuances: On some platforms, like Facebook, an excessively high CTR could even indicate click-happy behavior that doesn’t result in action. There’s also the concept of accidental clicks, especially on mobile display ads, which can inflate CTR but not reflect true interest. Google, for example, implemented measures to reduce accidental ad clicks (like on mobile interstitials). So always contextualize CTR with user behavior post-click. High CTR + high bounce rate = not so great. High CTR + decent time on site or conversion = you nailed it. Multi-channel attribution: A user might click an ad (registering a CTR for that ad) but not convert, then later come back via a different channel to convert. The initial click played a role in the journey. So even if some clicks don’t yield immediate outcomes, they could be contributing to a later conversion. Use analytics to observe how clicks translate to downstream actions, and adjust your strategy accordingly. For example, if a certain blog post gets a lot of clicks (traffic) but few direct conversions, it might still be valuable if it’s part of the research journey leading to later sales. You may then decide to keep promoting such content for top-of-funnel engagement while nurturing those visitors through retargeting or email to eventual conversion. Real-World Example: The Impact of CTR Optimization To illustrate, let’s consider a real-world style scenario. A company running Facebook ads noticed their CTR was languishing around 0.5%. They revamped their strategy: they narrowed the target audience to their ideal customer profile and redesigned creatives to be more eye-catching and benefit-driven. One of the changes included using a short video ad with a hook in the first 3 seconds. As a result, their Facebook ad CTR jumped to 1.5% (a 3× improvement). What did this yield? For the same impressions, they tripled the number of visitors coming to their site. That provided their sales team with a larger retargeting pool and ultimately led to more sign-ups. Interestingly, their cost per click also decreased, because Facebook’s algorithm rewarded the higher engagement (more clicks meant the ad was competitive in the auction). The campaign’s success fed on itself – higher CTR led to lower costs and more reach, which led to even more clicks. This demonstrates how focusing on CTR can amplify the overall efficiency of a campaign. Another case: an e-commerce email newsletter was getting a 1% CTR. The team decided to segment their list into two groups – high-value repeat customers and one-time buyers – and tailored product recommendations in each email accordingly. They also changed the email design to include clear product images with “Shop Now” buttons under each. The CTR of the segmented, redesigned emails rose to 3%. Over the course of a holiday season, this meant thousands of extra visitors to the site from email, and substantial additional revenue from those clicks that turned into purchases. The marketers observed that by simply making the email more relevant (via segmentation) and making the click opportunities more visually prominent, they dramatically improved engagement. These examples underline that improving CTR isn’t just an isolated win – it has cascading benefits on cost, on volume of leads, and ultimately on sales. By making each impression work harder for you, you maximize the returns on the reach you’ve earned or paid for. Conclusion Click-Through Rate is a vital sign of your marketing’s health. It blends the art of persuasion (does your message entice action?) with the science of targeting (are you showing it to the right people at the right time?). By paying attention to CTR and continually optimizing for it, you ensure that you’re not just getting your content in front of eyeballs, but also driving those eyeballs to actually engage. Remember to always interpret CTR in context. Aim for improvements, use benchmarks as reference, but ultimately judge success by the quality of those clicks too. A smarter, more engaged audience clicking through will outperform raw clicks from uninterested viewers. To recap actionable steps: Measure your current CTRs on all major channels and identify underperforming areas relative to benchmarks. Use the strategies outlined (better copy, better visuals, tighter targeting, etc.) to run experiments with new variations. Track the results and double down on what lifts your CTR – whether it’s a certain phrasing in ads or a particular email format. Keep the user’s intent and benefit front and center in your optimizations, and ensure the post-click experience delivers on what was promised. By making CTR optimization a regular part of your campaign management, you’ll likely see not only more clicks, but more effective marketing overall. Higher CTR means more engaged prospects, which is the first step to higher conversions and greater marketing success. So get creative, test rigorously, and watch those click-through rates climb!
    Infographic illustrating Return on Investment (ROI) metrics, formula, benchmarks, and strategies to maximize marketing ROI

    May 8, 2025

    Marketing Team

    Introduction: Return on Investment (ROI) is the ultimate bottom-line metric that asks, “For every dollar we put into our marketing, how many dollars do we get back?” In the end, the success of marketing isn’t just about clicks or leads – it’s about generating revenue and profit that exceed the costs. ROI connects marketing efforts directly to business outcomes. In this comprehensive guide, we’ll explore what ROI means in a marketing context and why it’s so crucial for decision-making and strategy. We’ll look at industry data on marketing ROI, discuss how to measure and attribute ROI in today’s multi-channel environment, and provide strategies for maximizing ROI – from choosing the right channels and tactics, to optimizing budgets, to tracking the metrics that matter. By focusing on ROI, marketers can ensure they are driving real value and continuously justify and improve the impact of their work. What is Marketing ROI? Marketing Return on Investment (ROI) typically refers to the revenue (or profit) generated from marketing activities relative to the cost of those activities. It’s often expressed as a ratio or percentage: ROI=Net Profit from Marketing Campaign / Cost of Marketing Campaign×100% Or sometimes as a revenue-to-cost ratio. For example, if you spent $10,000 on a campaign and it directly generated $50,000 in revenue, and let’s say the cost of goods or service delivery for that revenue is $20,000, then net profit is $30,000. ROI would be $30,000/$10,000 = 3.0, or 300%. In simpler terms, for each $1 spent, you got $3 back net, which is a 3:1 ROI. Some marketers calculate ROI purely on revenue (not subtracting cost of goods), especially if they don’t have good profit margin data by campaign. In that case, $50k on $10k spend would be 5:1 ROI (500%). Others focus on Return on Ad Spend (ROAS), which is revenue/ad cost, similar to ROI but without factoring other costs. However, ideally one should use profit in the calculation for a true ROI. If profit data isn’t available, revenue can be a proxy but must consider that not all revenue is equal (margins differ). Why ROI matters in marketing: Aligns marketing with business goals: ROI forces marketing to be accountable for generating more value than it consumes. It breaks the stereotype of marketing as a “cost center” by showing when marketing is a revenue driver. For example, if marketing ROI on a campaign is 200%, that means marketing activities doubled the money invested – a clear contribution to the bottom line. Budget justification and optimization: High ROI means you’re getting great bang for your buck, which can justify increasing budgets or expanding campaigns. Low or negative ROI is a warning sign to reallocate spend or change approach. In fact, 83% of marketing leaders now consider demonstrating ROI their top priority, indicating how critical it is for securing budget and trust. Companies base future budgets on past ROI performance – one stat says 64% of companies base budgets on ROI.  Measure effectiveness across channels: ROI is a common yardstick that allows comparison of very different marketing efforts on equal footing. You can compare ROI of, say, an email campaign vs a trade show vs Google Ads. Each has different costs and returns, but ROI normalizes it. If email marketing has 500% ROI and trade show has 50%, you clearly see which is more efficient financially (not to say you’ll drop trade shows necessarily – there may be strategic reasons – but it informs the strategy). Long-term strategic decisions: ROI not only guides daily tactical tweaks, but also big-picture strategy. For instance, if certain customer segments have much better ROI (maybe B2B customers ROI is higher than B2C for your biz), you might shift positioning or product focus to cater more to the higher ROI segment. Or if a particular product line yields poor marketing ROI, maybe its pricing or viability needs re-evaluation. Investor/Stakeholder confidence: Especially in companies mindful of profitability, showing a solid marketing ROI helps build confidence that marketing isn’t just spending – it’s investing. It is often said, “marketing is not a cost, it’s an investment” – ROI is how you prove that. Marketers who can speak in ROI terms can get the C-suite on board. Note that only 36% of marketers say they can accurately measure ROI, which suggests that those who can measure and articulate ROI have a competitive advantage in internal discussions. Adapt to market conditions: In economic downturns or budget cuts, ROI becomes even more critical. Companies will pour resources into the highest ROI activities and cut the rest. Marketing ROI analysis can highlight where to trim without significantly harming revenue, and where to preserve or even increase spend because it’s still yielding good returns (for example, ROI might actually increase in cheaper ad markets during a recession as others pull out). Benchmark against others: While many keep their ROI numbers private, industry benchmarks exist (like average ROI on email marketing, etc.) which we’ll discuss soon. Knowing if you’re above or below the norm can tell you if you have room to improve or if you’re leading the pack. It’s important to clarify that measuring marketing ROI can be challenging: Attribution can be tricky (e.g., someone sees an ad then later goes direct to site to buy – which gets credit? Multi-touch attribution tries to solve it). Some marketing is about long-term brand building which doesn’t have immediate ROI but pays off over time in increased baseline sales or pricing power. ROI for such efforts might not be immediately evident or might be measured in other ways (like brand equity surveys). There’s also the concept of ROMI (Return on Marketing Investment), which is basically the same as marketing ROI, sometimes used to emphasize marketing specifically. But even with complexities, the trend is toward data-driven marketing that can connect efforts to outcomes. The Firework stats earlier highlighted: 83% of marketing leaders prioritize demonstrating ROI, up from 68% 5 years ago – a sign that ROI accountability is increasing. Yet 47% struggle to measure ROI across channels, indicating attribution and integration challenges. So, measuring ROI is both more demanded and still hard – but techniques and tools are improving. Next, let’s see some high-level ROI statistics: A notable often-cited stat: Email marketing has an average ROI of $36 for every $1 spent, which is 3600%. That’s one reason email is hailed as one of the highest ROI channels. Some studies even claim up to $40:1 or more depending on industry. SEO is also known for high ROI in the long run. Focus Digital’s report indicated SEO had average ROI of 748% (for organic channels) – which was highest among channels they listed. They said organic social ~206%, LinkedIn 229%, email 261%, while paid ads were much lower (Meta 87%, Google Ads 36%).  That aligns with the idea that organic channels, while slower, yield very high ROI because the only costs are content and time, not paying per click. Another viewpoint: WordStream found average ROI on Google Ads is 200% (or $2 revenue per $1) when properly optimized.  That may have been a stat or an ideal – yes, WordStream cited a stat “PPC can yield $2 for every $1 spent” which is 200% ROI on ad spend. But that’s average; the top quartile of advertisers often see much higher, and some might break even or worse. Social media ROI metrics: A HubSpot stat said short-form video had highest ROI reported by 21% of marketers,  and also that 93% of video marketers see positive ROI on video ads (meaning video is working for them). Also, influencer marketing ROI: often cited that businesses earn $5+ for every $1 spent on influencer marketing on average – though that can vary widely. Many companies track marketing ROI holistically. The Gartner or CMO surveys often find marketing spend as a percent of revenue, etc., but ROI is sometimes reported. For example, one survey might find marketing on average drives a 1.5x to 3x return depending on sector, etc. A telling stat from Firework: Only 36% of marketers say they can accurately measure ROI – meaning many ROI calculations are estimates. Yet 83% prioritize it, so there’s a gap. And, 47% struggle with multi-touch attribution making ROI measurement across channels tough. Another from Firework: 64% of companies base budgets on past ROI, emphasizing how ROI influences future planning. Also interesting: content marketing ROI – “73% of B2B marketers say content marketing increases leads & sales”, implying they see good ROI in content. And video ROI: “49% faster ROI from video content vs text” (some stat in Firework). One more: According to WordStream, branded search ads have 2x ROAS of non-brand (makes sense since branded are high intent). Wyzowl 2024 said 93% of video marketers feel video gives positive ROI.  For email, Firework/ConstantContact stats: average ROI email $36:$1 (some industries up to $45:$1), making it arguably top channel ROI. Social media: some HubSpot data suggests Facebook has highest influencer marketing ROI (per 28% marketers), Instagram second. But as a channel, social ROI can be tricky because of indirect effects (awareness, engagement). Something about data-driven marketing: companies using advanced analytics report 5-8% higher marketing ROI – meaning using data improves ROI. All these point to a few trends: Certain channels (email, SEO, content) yield very high ROI if done right, because costs are low relative to reach/potential revenue. Paid channels can have positive ROI, but typically lower percentages (because you pay for each view/click). Short-form video and new content forms are delivering good ROI in recent years. ROI measurement challenges persist, but companies are focusing on improving that via tools and AI (30% businesses expected to use AI analytics to improve ROI by 2025). ROI isn’t just about channel, but also how it’s executed (targeting, creative, etc. – a poorly run email campaign can have negative ROI, a great paid campaign can have high ROI). At its core, ROI gives the big picture: Are we making or losing money due to marketing? And how can we make more? How to Measure and Attribute Marketing ROI Measuring ROI can be straightforward in direct response campaigns but tricky in multi-touch customer journeys. Here are steps and considerations: Define what to measure: Are you measuring ROI per campaign, channel, or overall? Overall marketing ROI might include all sales attributable to marketing (sometimes all sales, if marketing touches every customer) and all marketing costs. More granular ROI might look at specific initiatives. Track costs accurately: Include all relevant costs. For a digital campaign, that’s ad spend, plus creative costs (design, copywriting), any tools or agency fees. For overall, include salaries of marketing staff, content production costs, etc. The more comprehensive, the better to know true ROI. A hidden cost often missed is opportunity cost or overhead allocation (but usually, you stick to direct costs). Track revenues accurately: This is hardest. If you have e-commerce, you can directly attribute revenue to clicks or campaigns fairly well with good tracking (e.g., Google Analytics shows transaction amount per traffic source). If you’re B2B with a sales cycle, you need to attribute closed sales back to marketing sources. This is where CRM systems (like Salesforce or HubSpot CRM) come in – tie every lead to a source, and when it closes, attribute the revenue to that source. But often multiple touches contribute (first-touch, last-touch, etc.). Attribution models: Single-touch (first or last) is simplest but can mis-credit. Multi-touch models (linear, time decay, position-based) assign fractions of revenue to each touch. For ROI, multi-touch is ideal but complex – you might just pick one model and consistently use it. Some advanced companies use algorithmic or AI-driven attribution which finds correlations between marketing touches and conversion. Example: A customer saw a Facebook ad (didn’t click), later searched and clicked an organic link, then later got an email and converted. Who gets credit? First touch (Facebook) or last (email) or multi? A multi-touch might give 33% credit each. Then you’d count 33% of that sale’s revenue in Facebook ROI calculation, etc. That’s one way. Include lifetime value or just immediate revenue? Some measure ROI on immediate purchase revenue. Others incorporate projected LTV (especially for subscription businesses). For example, if a new customer spends $100 now but has an expected LTV of $500, your ROI might be far higher when factoring full LTV. However, using LTV in ROI can be risky if assumptions are wrong or if the company has to wait years to realize that return. A common approach: measure ROI on a one-year value or similar period. Or mention both – e.g., “Our 6-month ROI is 150%, and 24-month ROI projected 300%.” Time frame: ROI can be measured per campaign (campaign run, plus say a couple months after to capture lagging conversions). For ongoing channels, measure ROI monthly or quarterly, but note that some investments (like SEO content) have upfront cost and yield over a long period. Often marketers look at ROI annually to factor in these longer plays. Use of technology: Modern analytics tools (Google Analytics 4, attribution software like Attribution, HubSpot, etc.) help unify data. They can show ROI by channel if you input cost data. For example, GA can import cost from non-Google channels to calculate ROAS/ROI if e-commerce tracking is in place. Test incrementally: One subtlety – true ROI should consider what sales you wouldn’t have had without marketing. For instance, some customers might buy anyway due to brand or repeat purchase even if you didn’t market to them. So the incremental ROI could be lower than surface-level if some marketing spend is reaching customers who would have converted regardless. Large advertisers do hold-out tests (e.g., turn off marketing in a region to see how sales compare, to gauge incremental lift). That’s advanced but the gold standard for knowing real ROI. Many can’t do that easily, but be aware that not all attributed revenue is 100% incremental. Account for external factors: If overall demand is rising (market growing), ROI might appear great, but some growth might be organic. Or if competitors cut marketing, your ROI might shoot up (less competition in auctions). Always contextualize ROI in the environment. Now, at the risk of sounding repetitive, measure, measure, measure. The Firework stat said only 36% can measure ROI accurately. Tools and processes to improve that measurement are worth the effort because you can then make more informed decisions. For companies unable to tie directly, some use proxies like marketing influenced revenue (like how many deals had at least one marketing touch), or use market mix modeling (statistical analysis on spend vs sales over time controlling for other factors) to estimate ROI for channels. That’s a big-data approach often used by large firms aside from attribution. Setting ROI goals: Many firms set target ROI or ROAS. E.g., “We need at least 5:1 ROAS on ads to be profitable.” Or “We aim for 300% marketing ROI each quarter.” These targets often come from margin requirements or historical data. If product margin is 50%, then to break even on profit, ROI must be at least 200% (because 100% ROI means you spent and got equal revenue, which at 50% margin means you lost money). So ROI goals often > 100%. Some aim high to maximize profit (if there’s plenty of market, you want as high ROI as possible). Others deliberately accept lower ROI (even below 100%) to drive growth (investing in customer base now for future profit, as in many startups who have negative marketing ROI in early years by design). One more nuance: There’s also ROMI (return on marketing investment) which is same concept. And sometimes Marketing ROI might try to isolate just marketing’s effect if sales and product teams also contribute. Anyway, measuring ROI properly sets the stage to maximize it. Let’s move to strategies to improve ROI: Strategies to Maximize Marketing ROI Improving ROI is essentially about either increasing the returns (revenue) or decreasing the investment (cost), or ideally both. It’s the culmination of all optimizations in earlier metrics (CTR, CPL, CPA) and then some. Here are strategies: 1. Double Down on High-ROI Channels and Campaigns: Identify which channels are delivering the highest ROI. For example, if email marketing is bringing in a 5:1 ROI and paid search is 2:1, consider focusing more resources on email (grow your list, send more effective campaigns) as long as it can scale. Many companies find a large chunk of revenue comes from a small number of channels or campaigns (the 80/20 rule). If a particular campaign or content piece is converting extremely well, drive more traffic to it (e.g., promote a high-converting webinar more). Within campaigns, see which target segments or ads have best ROI. It might be that one customer segment yields much higher purchase rates or values. Shift targeting to those segments. Or one ad message yields higher quality customers. For instance, a finance software company might see ROI is higher on campaigns targeting CPAs than campaigns targeting general small businesses (maybe CPAs have bigger budgets or higher retention). Thus, focus on CPAs. That Firework stat that 64% companies base budget on ROI suggests a dynamic allocation: each quarter or year, move budget toward higher ROI activities and reduce or cut the low ROI ones. Essentially, treat your marketing portfolio like an investment portfolio – invest more in what’s yielding best returns (as long as it’s scalable). But watch for diminishing returns: The first dollars in a channel often produce highest ROI, and as you saturate, ROI can drop. Continuously monitor as you scale up spend – ensure the ROI remains above your threshold. Example: content marketing has huge ROI on existing content (because you already paid the cost, ongoing traffic is “free”), but creating new content has cost – ensure new content still meets ROI expectations (e.g., does it attract enough new revenue to justify creation cost?). Conversely, if some efforts consistently underperform on ROI, be ruthless in cutting them, unless there’s a strategic reason (e.g., you might keep some brand awareness spend that’s hard to measure ROI on, but you believe it supports other channels’ ROI). 2. Optimize Budget Allocation and Media Mix: Use marketing mix modeling or attribution to find if shifting spend yields better ROI. For instance, an analysis may show that at current spend levels, each extra $1 in channel A yields $2, while in channel B yields $1.20. You’d then re-balance to A until equilibrium. Some companies do this systematically each quarter using models or simply test small increases/decreases in channels and measure impact on sales to gauge marginal ROI. Diversify if needed to find new high-ROI opportunities (like testing emerging channels). But also avoid thinly spreading budget across too many channels that you can’t optimize each well – better to have a few well-optimized channels than many poorly run ones. The idea is to put dollars where they work hardest. Scenario: paid search ROI might decrease after a certain budget because you start bidding on less profitable keywords. Instead of forcing more into search, maybe funnel extra budget into an email lead nurturing program which has capacity to yield more revenue at low cost. This mix change can improve overall ROI. Holistic approach: Recognize interplay – some channels assist others. A purely last-click ROI view might undervalue early funnel channels that create awareness. If cutting those causes total conversions to drop, overall ROI might fall. So ensure in allocation you consider attribution properly. Possibly use some budget on lower immediate ROI channels if they lift performance of high ROI channels (e.g., brand advertising might improve brand search conversion rates, etc.). Keep an experimental budget (say 10-15%) for new initiatives and measure their ROI carefully. If any experiment beats existing channel ROI, promote it to core budget. 3. Increase Conversion Rates at Every Stage (Boost Revenue Side): Improving CTR, CPL, CPA – all the metrics we discussed – directly feeds ROI by reducing cost per outcome. But also increasing conversion means more revenue from the same spend. This includes website CRO (conversion rate optimization): If you can get more visitors to take the desired action (buy, sign up) on your site, you generate more revenue per marketing click. For instance, you invest in a site redesign that lifts your e-commerce conversion rate from 2% to 3%. That’s a 50% increase in customers for the same traffic. ROI of marketing campaigns would jump (because revenue rose 50% for same cost). Many companies find CRO on landing pages, product pages, etc., to be among the highest ROI activities because it multiplies the value of all your traffic. Upsell & Cross-sell: Increase average order value or customer lifetime. If you can persuade a certain percentage to add a complementary product or upgrade to a higher plan, you increase revenue from the same acquisition cost. That yields higher ROI. Example: Amazon’s recommendation engine (“Frequently bought together”) – by increasing basket size, the ROI of getting someone to the site improves. For SaaS, having good upgrade paths can make initial CAC pay off more. The key is marketing should also focus on existing customer marketing (not just acquisition) – often email or in-app marketing to customers can upsell at minimal cost (thus extremely high ROI on those activities). Retention marketing: Keep customers longer (if recurring revenue) so their lifetime value goes up without additional acquisition cost. Tactics: loyalty programs, ongoing engagement via content/community, remarketing to existing customers for repeat purchases. For instance, if you run promotions to previous customers and 10% make another purchase, the ROI on those emails or ads is huge (they’re cheaper to advertise to than acquiring new, and they already trust you). There’s a stat: increasing customer retention by 5% can increase profits by 25-95% (often cited from Bain). That speaks to ROI – money spent on retention (like a loyalty email) can be super ROI-positive because selling to an existing customer is cheaper than to a new one (some say by factor of 5). Improve Sales Efficiency (for sales-heavy models): If marketing drives leads, and sales closes them better (faster cycle, higher close rate), that means more revenue per marketing dollar. For marketing ROI on those leads, include sales cost as part of “investment.” If you cut sales cost per deal (through automation or training as discussed earlier), the “investment” portion goes down or more deals closed for same cost – ROI improves. E.g., implementing a chatbot to qualify leads faster might boost sales productivity – maybe each sales rep can handle 20% more leads, effectively reducing cost per conversion, boosting ROI. Personalization: Using personalized content or offers can significantly lift conversion rates. For example, personalizing website experience to user segments can increase engagement and conversion – e.g., showing relevant case studies by industry, or products based on browsing history. If revenue per visitor goes up due to personalization, ROI goes up (cost didn’t change). A statistic from Evergage/Researchscape said 88% of marketers saw measurable improvements with personalization, and some see a return exceeding 1:5 on personalization investments. Essentially, small tech investments in personalization can yield outsized revenue improvements. 4. Reduce Marketing Costs without Sacrificing Impact: Automation and AI: Use AI tools to automate tasks like bid optimization, content creation drafts, email send time optimization, etc. This can reduce labor costs or improve performance (or both). For example, if an AI tool can manage your PPC bids better than manual, it might achieve same results with 10% lower spend (improving ROI), or better results with same spend (also improving ROI). AI in content (like using ChatGPT to write first drafts that your team edits) could lower content creation cost, thus lower “I” in ROI while maintaining “R”. A Firework stat predicted 30% of businesses will use AI-driven analytics by 2025 to improve ROI and those embracing advanced analytics already report 5-8% higher ROI. Negotiate with vendors/agencies: If you use an agency or tools, see if you can renegotiate fees as you scale or find cheaper equivalent tools (without hurting performance). Reducing overhead contributes to ROI. Example: switching to a more cost-effective email service provider or negotiating a bulk rate on a media buy could shave cost. Eliminate waste: Identify parts of campaigns that spend money without returns. Common culprits: Paying for irrelevant clicks (fix via negative keywords, better targeting). For instance, a broad match might be spending on terms unrelated to your product – cutting those saves budget with no revenue loss. Overlapping targeting causing bidding against yourself or saturating frequency in display where additional impressions don’t add value (cap frequency to avoid overspending). Unproductive marketing experiments dragging on – have a kill criteria for new initiatives that don’t show promise so you stop bleeding cost. Even simple things like controlling scope of a campaign (maybe you’re advertising nationwide but only certain regions buy; focus on those regions). In-house vs outsource: If agency fees are high and you have capacity, bringing some capabilities in-house might lower cost (once ramped up). Conversely, if an agency or tool can do something far more efficiently (and cheaper) than your team doing manually, use them. Always evaluate cost vs outcome. ROI includes not just media spend but all overhead, so optimize organizationally too. Economies of scale in buying: If you plan large spends, negotiate – e.g., commit to a certain spend level on a platform for a discount. Some ad platforms or vendors might offer bonuses or reduced rates for big commitments (though Google/Facebook not so much on ads themselves, but maybe other platforms or sponsorships). Content repurposing: Get more out of what you create. A whitepaper can be sliced into blog posts, infographics, webinar, etc. That means for one content creation cost, you get multiple pieces driving leads. This increases the return for the same investment. Many savvy content marketers use one “big” piece to fuel dozens of small pieces, maximizing ROI on content production. 5. Invest in Measurement and Analytics to Continually Improve ROI: As mentioned, better attribution can help cut waste. It’s worth investing in analytics infrastructure (tracking tools, hiring a data analyst) because finding even one major insight (e.g., channel X ROI is actually negative, channel Y is great) can shift budgets tens of thousands of dollars more effectively. The ROI on analytics can be very high if it leads to improved decisions. Set up dashboards that combine cost and revenue data. For instance, a marketing dashboard that shows ROI by campaign in near real-time. This allows agile adjustments. If you see one campaign’s ROI dipping this week, you can tweak or pause it before it burns a hole. Test and iterate culture: Always be running experiments – A/B test landing pages, test new audiences, test different discount levels, etc. Each successful test that improves conversion or reduces cost directly boosts ROI. For example, an A/B test might reveal a certain ad creative yields 50% more sales – you then use that creative moving forward to get more from each ad dollar (increase returns). A stat from Firework: Data-driven companies report 5-8% higher marketing ROI. That seems small, but compounding over time, that’s significant extra profit. Also likely those companies can scale knowing ROI is positive. Embrace marketing attribution/analytics tools (e.g., HubSpot, Google Analytics, Adobe, etc.) – make sure all campaigns have proper UTM tagging, and that sales is feeding back offline data (like if deals close offline, get that into the marketing system to connect the dots). 6. Focus on Customer Value and Experience (Indirect ROI Benefits): This touches retention but beyond that – a great product and customer experience can create organic growth (word-of-mouth) which is essentially free marketing. Satisfied customers are brand ambassadors; this lowers future acquisition costs (someone might come to you via referral or strong brand without heavy marketing). That in turn improves marketing ROI because some sales come at no or low marketing cost. Example: If you invest more in customer success (not typically counted in marketing cost) and it leads to more referrals, your marketing ROI on referral campaigns goes up drastically. Another angle: if you improve brand perception, you may find your marketing campaigns convert better (brand trust means higher CTRs, more conversions). This can be hard to measure short-term ROI, but over time contributes. For instance, content marketing might not yield immediate direct sales, but it builds brand authority which increases conversion rates on your other campaigns (thus raising their ROI). Ensure marketing messages and targeting focus on high-LTV customers. A certain customer segment might not only convert easily but also stick around and spend more (thus higher lifetime revenue). If you aim your marketing at them, ROI considering LTV is far higher. Sometimes, marketing & product teams refine targeting to attract better customers, not just more customers. Quality of customers gained is as important as quantity for ROI. Case study example: Starbucks has high marketing ROI partly because they get tons of repeat purchases (loyalty). They invest in the app and loyalty program which aren’t direct “marketing” like ads, but those efforts increase retention and frequency, massively boosting the returns from their relatively small advertising budget. So broadening thinking about marketing to include customer experience and loyalty can pay off. 7. Consider the Time Horizon of ROI: Some marketing efforts have delayed ROI (like SEO content might take months to rank, but then yields high ROI). If you cut them too early because immediate ROI is low, you might lose out on big returns later. A balanced approach is needed – allocate a portion of budget to high-ROI short-term efforts (for immediate cash flow) and some to high-ROI long-term efforts (for future growth). Track ROI over appropriate time frames. Perhaps measure ROI of content marketing over 12 months rather than the first month it’s published. It might be negative in month 1 (cost incurred, little traffic), but by month 12 maybe that piece has 10x ROI. If you have buy-in from leadership on long-term strategy, you can invest in these with confidence, measuring interim leading indicators (like organic traffic growth, etc.), and eventually show the ROI in financial terms. On the flip side, be careful with “we think it’s long-term brand” as an excuse for poor ROI if there’s no evidence it’s actually benefiting. Aim to find proxies or correlation (like increased direct traffic or search volume for brand after brand campaigns) to justify them. 8. Train and Enable the Marketing Team: A well-skilled team will produce better campaigns and make smarter choices, leading to better ROI. Invest in training (like sending the team to conferences or online courses to learn new tools and techniques). For instance, a marketer skilled in Google Ads will achieve higher ROI in campaigns than a novice who wastes spend on wrong settings. Encourage a mindset of “ROI ownership” in the team. If each specialist (email marketer, PPC manager, etc.) is aware of their channel’s ROI and feels accountable for improving it, they’ll be proactive in finding optimizations. Also ensure marketing and sales teams communicate. Alignment (e.g., on lead quality feedback, messaging consistency) can improve conversion, hence ROI. If marketing knows which leads turned out great, they can adjust targeting to get more of those, etc. Case Example to illustrate ROI improvement: Suppose a company’s marketing ROI last year was 150% (1.5:1) – they spent $1M, got $1.5M in revenue attributable. To improve this year, they: Discovered via analysis that one advertising channel had just 50% ROI (losing money effectively), while another was 300%. They cut the low one and put those funds into the high one. Instantly, overall ROI might move closer to, say, 180%. They invested in CRO on their website, increasing overall conversion rates by 20%. That means for same traffic, revenue is 20% higher – ROI might go from 180% to ~216%. They also renegotiated an email software contract saving $50k, and used more in-house content creation saving another $50k. Now costs down by $100k on similar revenue, ROI maybe jumps to ~230%. Meanwhile, by focusing on higher-LTV customers (tweaked targeting to enterprise rather than small biz, who renew more often), the average revenue per customer increased, further boosting returns from the fixed costs. By year end, they measure and find marketing spend $900k (they saved some cost) and revenue $2.1M (higher conversion + value) – ROI nearly 233%. This is a simplified illustration, but it shows how many small improvements compound: better mix, better conversion, lower cost – turning a modest ROI into a strong one. Important: ROI is the end summary metric, but you improve it by working on all the components we discussed in prior articles: attracting more audience (visits), engaging them to click (CTR), converting them to leads efficiently (CPL, CPA), and doing so cost-effectively, plus maximizing each customer’s value. It’s the holistic score. In presenting or discussing ROI improvements, tie them to tangible business outcomes: e.g., “Our marketing ROI increased from 200% to 300% after optimizing our campaigns – meaning last quarter we generated $3 in revenue for every $1 spent, compared to $2 for every $1 before. This added $X in incremental profit.” This resonates with executives. According to Firework, 83% of marketing leaders now treat demonstrating ROI as top priority. They also mentioned only 36% can measure it well – so if you do measure and improve ROI, you’re ahead of many. Finally, always consider diminishing returns vs growth goals. Sometimes maximizing ROI (as a percentage) might conflict with scaling volume. For example, if you only cherry-pick the absolute highest ROI initiatives, you might under-invest and leave growth on the table (like maybe you could double spend at slightly lower ROI but still healthy, and get more total profit). Many companies will accept a lower ROI if it means more absolute profit and market share. The key is to maintain ROI above a threshold of profitability while growing. So “maximize ROI” often means “maximize under constraints of growth objectives or profit targets.” If purely maximizing percentage ROI, you might oversimplify (e.g., spend only on email to existing loyal customers – ROI infinite practically, but you won’t grow new customers). There’s a balance: invest enough to hit growth targets while keeping ROI as high as possible. In conclusion of strategies: ROI is king, and to improve it, use all the levers: cut waste, invest in winners, optimize conversion, increase customer value, reduce costs, and measure fiercely. With ROI in focus, marketing truly becomes a revenue engine rather than a cost center. Conclusion: Making Marketing Count Marketing ROI is the ultimate report card for your marketing strategy. It encapsulates the effectiveness of every click enticed, every lead nurtured, and every dollar spent. By focusing on ROI, you ensure that your marketing efforts are not just generating activity, but generating value.
    Infographic illustrating Total Website Visits metrics and strategies for building a strong marketing funnel foundation

    May 7, 2025

    Marketing Team

    Introduction: Total website visits represent the total number of times users have landed on your website within a given period (regardless of repeats). It’s a top-of-funnel metric that indicates the volume of traffic your marketing efforts are bringing in. Think of it as the digital equivalent of foot traffic to a store. More visits mean more opportunities for conversions, making this metric a critical starting point for any marketing strategy. In this article, we’ll break down what total visits encompass, why they matter, how to benchmark your traffic, and proven strategies and tools to boost your website visits. What Are “Total Website Visits”? “Total website visits” (also called total sessions or total traffic) measures the overall number of visits to your site, including repeat visits from the same people. It’s different from unique visitors, which count each person once. For example, one person visiting your site five times in a week would contribute 5 total visits but only 1 unique visitor. Marketers often track both, but total visits gives a sense of your site’s overall activity level. This metric encompasses all traffic sources – organic, paid, direct, referral, social, etc. – and thus reflects the cumulative impact of your marketing channels. Why is this important? Total visits are a strong indicator of brand awareness and reach. If your campaigns (SEO, ads, social media, email, etc.) are effective, you’ll see those efforts pay off in more site visits. Conversely, a drop in visits can flag issues like decreased visibility or technical problems. While visit quantity doesn’t guarantee quality, you generally need a healthy volume of traffic to generate leads and sales. Why Total Website Visits Matter 1. It feeds the funnel: Every sale or lead typically begins with a website visit. A larger volume of visits means more chances to convert new customers. Even if your conversion rate holds steady, doubling your visits roughly doubles your opportunities to generate leads or sales. 2. Gauging brand interest: Total traffic can be a barometer of your brand’s visibility in the market. A spike in visits might indicate a successful campaign or viral content, whereas a decline could signal lost visibility or competitive pressure. For example, if you launch a new ad campaign or content initiative, one of the first signs of success is often an uptick in site traffic. 3. Benchmarking growth: Marketers and executives often set goals around increasing website visits by a certain percentage. Tracking this metric over time helps you see if your marketing activities are driving more people to your site. In fact, year-over-year web traffic tends to rise for many businesses. One recent survey found 43% of websites reported an increase in traffic compared to the previous year, while only 14% saw a decrease. Consistent growth in visits is usually a positive sign that your overall marketing strategy is expanding your reach. 4. Diagnosing issues: A sudden drop in visits can alert you to problems like website downtime, SEO penalties, or broken campaigns. For example, if your site traffic plunges overnight, it might indicate your site went offline or your tracking code was removed – prompting immediate investigation. 5. Impact on other metrics: Traffic volume also affects other KPIs. Conversion counts (leads or sales) are obviously tied to how many visitors you have. Even metrics like Cost Per Acquisition or Cost Per Lead improve when you can generate more organic (free) traffic, since it lowers the average cost by bringing in more prospects at little to no expense. In short, a healthy flow of traffic is the first step toward healthy revenue. In summary, total visits are the lifeblood of your digital funnel. However, remember that quality matters too. 5,000 highly targeted visits can outperform 50,000 untargeted ones. That’s why this metric should be evaluated alongside engagement and conversion metrics – more on that later. Industry Benchmarks for Website Traffic It’s natural to ask, “Is my website traffic good for my industry or company size?” While there is no one-size-fits-all answer, benchmarking data can provide context. Recent research by HubSpot found that the median website gets about 20,000 monthly unique visitors, while the average (pulled upward by very large sites) is around 375,000 per month. In other words, a typical mid-sized site might see ~20k visitors monthly, but larger sites (or those with viral content) can attract hundreds of thousands. Traffic also varies widely by industry and business model. For example, content-heavy industries (media, blogs) or B2C retail might naturally get more visits than niche B2B service sites. Yearly trends are encouraging: a majority of websites have been experiencing traffic growth. Only 14% of companies reported a year-over-year decline in traffic, whereas 43% saw an increase. This suggests that overall digital audiences are growing – potentially due to increased internet use and effective digital marketing tactics in recent years. Another useful benchmark is traffic source distribution. On average, organic search drives the largest share of web traffic (around 53%), far more than paid search (roughly 27%). This underscores the importance of SEO and content marketing in attracting visitors. It also implies that if your site relies heavily on paid ads for traffic, you might be missing out on the “free” visitors that strong search engine presence can deliver. Many companies strive for a balanced mix of organic, direct, and referral traffic so they aren’t overly dependent on paid campaigns. Engagement benchmarks: When those visitors arrive, how do they behave? Industry metrics show that the *average website visit involves about 7 page views. Bounce rates (the percentage who leave after one page) average ~37%, meaning roughly 1 in 3 visitors leaves immediately on an average site. If your bounce rate is significantly higher, or pages per visit lower, it may indicate issues with your content relevance or user experience. High-performing sites keep visitors engaged with relevant content, leading to multiple pageviews per session. Finally, consider competitor benchmarks. Tools like Google Analytics Benchmarking (anonymized industry data) or platforms like SimilarWeb can help compare your traffic to industry peers. If you find your site is getting only a fraction of the visits of a similar competitor, that’s a signal to invest more in awareness and traffic-driving campaigns. Tools and Platforms to Measure Traffic To improve something, you need to measure it. The go-to tool for tracking website visits is web analytics software. The most popular (and free) choice is Google Analytics, which, once installed on your site, will report total sessions, users, pageviews, and a wealth of other data. In Google Analytics (GA4), the “Sessions” metric corresponds to total visits. GA can break down visits by channel (organic search, paid ads, social, etc.), geography, time of day, and more, giving you insight into where your visitors are coming from. Other tools and platforms include: Server logs / Web hosting analytics: Many hosting providers offer basic traffic stats (hits, visits, etc.). These are less user-friendly than GA but useful as a backup or accuracy check. Marketing automation and CRM systems: Platforms like HubSpot, Adobe Analytics, or Salesforce Marketing Cloud can also track website visits if you use them for your site and landing pages. These can tie visits to leads or customer records, helping you see who is visiting in addition to how many. SEO tools for estimating traffic: Tools such as SEMrush or Ahrefs estimate organic search traffic to you and competitors. While not 100% accurate, they’re useful for benchmarking against competitors or researching which content drives visits. Heatmap and user session recording tools: While not for raw traffic count, tools like Hotjar or Crazy Egg show how visitors navigate your pages once they arrive. This can help improve on-site engagement (which can indirectly boost total visits through better retention and word-of-mouth). Make sure you have analytics properly set up to capture all your visits. For instance, if you launch a new microsite or campaign landing page on a separate domain or subdomain, include it in your tracking. Missing tracking code on some pages can lead to undercounting visits. Regularly audit your analytics to ensure data accuracy. Strategies to Increase Your Website Traffic Driving more traffic is a core goal for digital marketers. Here are several proven strategies, each targeting a different channel or method to get those visit numbers up: Search Engine Optimization (SEO): Improve your site’s visibility on search engines to capture more organic traffic. Start with keyword research to identify terms your audience searches for. Optimize your on-page elements (titles, meta descriptions, content) around those keywords, and ensure your site is technically sound and mobile-friendly. Building high-quality backlinks will also boost your rankings. SEO is a long-term play, but it’s incredibly powerful – organic search is the highest-ROI traffic source for many businesses. In fact, being on the first page of Google is critical: one study found that moving up just one position in Google’s results can increase click-through rate by **32%*, which can translate to a significant traffic uptick. Content Marketing: Create valuable, relevant content that attracts visitors. Companies that blog regularly generate 55% more website visitors than those that don’t. Each blog post or article is a new opportunity to rank in search and be shared on social media. Consider a mix of formats – blog posts, infographics, videos, webinars – to appeal to different audiences. Over time, a library of quality content turns your site into a traffic magnet (people find your resources via Google, social shares, etc.). Also, video content is exploding: it’s projected to make up 82% of all internet traffic by 2020. Publishing engaging videos (and possibly transcribing them into articles) can capture visitors who prefer visual content and improve time on site. Social Media Promotion: Leverage social networks to drive traffic back to your site. Share your content on platforms where your audience hangs out – whether that’s LinkedIn, Facebook, Twitter, Instagram, or niche communities. Build an engaged following by sharing tips, visuals, and interactives that link to your site. For example, if you publish a new blog post, create a compelling snippet or graphic and post it with a link. Engaging in industry groups or discussions (e.g., a popular LinkedIn group or Reddit community) with genuinely helpful input can also earn you referral clicks. Social traffic often has lower intent than search, but it can introduce new audiences to your brand. Email Marketing: Utilize email newsletters and campaigns to bring visitors back. Sending out a weekly or monthly digest of new content or promotions can re-engage past visitors. If you’ve built an email list (from sign-ups, customers, etc.), those are people who’ve already shown interest. A compelling email with links to your site (blog articles, product updates, etc.) can drive a surge of repeat traffic. Email is highly effective because you’re reaching an audience that has opted in – it’s no surprise that for B2C brands, email marketing is the #1 channel for ROI and driving traffic back to site. Just be sure to provide value in your emails (e.g., useful content, exclusive offers) so people actually click through. Paid Advertising: Run targeted ad campaigns to quickly boost visits. Pay-per-click (PPC) search ads on Google can put your site at the top of search results for your keywords, driving qualified traffic (for a price). Display ads and social media ads can also bring in visitors, especially for brand awareness. The key is smart targeting and budgeting – focus on keywords and audiences that align with your offering so the traffic is relevant. Track metrics like click-through rate (CTR) and cost per click (CPC); for instance, *average CTRs are about 6.4% on search ads and 0.5–1% on display ads on average, so adjust your creative and targeting if you’re below benchmark. While paid ads cost money, they are a direct way to scale up traffic and can be turned on or off as needed. Referral Partnerships: Partner with other websites or influencers to send traffic your way. This could include guest posting on industry blogs (where your bio link brings readers back), collaborating with influencers who can share your site or content, or getting listed in online directories/review sites relevant to your business. For example, a B2B software company might partner with a complementary service for a co-written whitepaper – each partner drives their audience to a landing page. Such partnerships tap into established audiences and can lead to sustained referral traffic if the content remains up. Improve User Experience & Speed: While this is more about retaining traffic than acquiring, it’s worth noting: if your site loads slowly or is hard to navigate, visitors will leave and might not return. A fast, user-friendly site encourages more pageviews per visit and repeat visits. Technical SEO improvements (like faster load times, mobile optimization) not only please users but also boost your search rankings, indirectly leading to more traffic. Aim for core web vitals in the green – a fast site can reduce bounce rate (average bounce is ~37%, so if yours is much higher, speed could be a factor). By combining these strategies, you create a multi-channel approach to growing traffic. For example, your SEO and content efforts bring steady organic visitors, social and email amplify your reach, and occasional ad campaigns provide spikes or help kickstart momentum for new initiatives. Importantly, these tactics often reinforce each other – e.g. more content improves SEO, which gives you more to share on social and email. Use Case: From Traffic to Leads – The Bigger Picture It’s worth illustrating how boosting total visits can cascade into broader marketing success. Imagine you run an online B2B service and average 5,000 visits/month with a 5% conversion rate to leads (250 leads/month). You invest in content marketing and SEO over six months and double your traffic to 10,000 visits/month. Even if your conversion rate stays 5%, you’d now generate 500 leads/month – doubling your leads just by increasing traffic. In reality, conversion rates often improve alongside better targeting and content relevance, so you might see even more leads. This simple math highlights why traffic growth is a fundamental goal. Consider the example of a company that started an educational blog to attract their target audience. By publishing SEO-optimized articles weekly and sharing them via LinkedIn and email, they steadily grew monthly site visits from 2,000 to 10,000 over a year. As a result, their inbound lead flow increased proportionally, and marketing could scale back some expensive paid campaigns. The traffic growth not only brought in more leads but also reduced Cost per Lead (since more free/organic visitors were now converting). This demonstrates how focusing on total visits creates a positive ripple effect through the rest of your metrics – more at-bats at conversion, at a lower cost. Of course, it’s vital to monitor the quality of traffic. If the additional visitors aren’t part of your target audience, they won’t convert and may even skew your analytics. Always pair traffic metrics with engagement metrics (time on page, pages per visit) and conversion metrics to ensure you’re attracting the right visitors. For instance, if you see a surge in visits but an increase in bounce rate and no change in leads, that traffic may not be very relevant – you might need to refine your tactics to target more qualified audiences. Key Takeaways Total website visits count every trip people make to your site. It’s a core metric that reflects the success of your awareness and acquisition efforts. This metric matters because it fuels your funnel – you need a steady (and growing) stream of visitors to generate consistent leads and sales. More visits = more opportunities. Benchmark your traffic against industry norms and past performance. The median site sees ~20k monthly visitors, and many sites are growing year-over-year. Aim to outpace the average in your niche and continuously grow your audience. Use robust analytics tools (like Google Analytics) to track total visits and their sources. Pay attention to how traffic is split between channels (organic, paid, etc.) – e.g., organic search typically delivers the majority of traffic for most sites. Employ a mix of traffic-generation strategies: SEO and content marketing for sustainable organic growth, social media and email to engage communities and re-engage users, and targeted paid campaigns for quick wins and expanded reach. Companies that execute on these fronts (like consistent blogging) see significantly higher traffic (50%+ more visitors) than those who don’t. Finally, remember that traffic is a means to an end. Monitor how those visits convert and interact. By attracting high-quality traffic and giving visitors a great onsite experience, you set the stage for converting a healthy portion of those visits into leads, customers, and revenue. Tracking and growing total website visits is often the first chapter of marketing success. With the tactics outlined above and a data-driven approach, you can drive more of the right people to your website – filling the top of your funnel and positioning your brand for greater growth down the line.
    Infographic illustrating Cost Per Lead (CPL) concepts, benchmarks, and optimization strategies to maximize lead-generation efficiency

    May 6, 2025

    Marketing Team

    Introduction: Every marketer wants more leads, but equally important is understanding what you’re paying to get those leads. Cost Per Lead (CPL) is a critical metric that quantifies how cost-effective your marketing campaigns are at generating new prospects. In simple terms, it’s the amount of money you spend to acquire a single lead (where a lead is typically a potential customer who has expressed interest, for example by filling out a form). In this article, we’ll explain exactly what CPL measures and why it matters, examine how CPL varies by industry and channel with real benchmark data, and provide strategies and tools for lowering your CPL while keeping lead quality high. By mastering CPL, you can get more bang for your marketing buck and improve your overall ROI. What is Cost Per Lead? Cost Per Lead (CPL) is the average cost of generating one lead. The formula is straightforward: CPL = Total Marketing Spend / Number of Leads Generated​ For example, if you ran a Facebook Ads campaign that cost $500 and it resulted in 50 leads (e.g., 50 people filled out your signup form), your CPL for that campaign is $10. If your monthly marketing spend across channels is $5,000 and you acquired 250 leads total, your overall CPL is $20. A “lead” in this context is usually someone who has provided their contact info or taken a step indicating interest (such as downloading a whitepaper, signing up for a webinar, or requesting a demo). Leads are often the lifeblood of B2B and high-consideration B2C marketing funnels, bridging the gap between anonymous traffic and paying customers. Why CPL matters: It indicates the efficiency of your marketing spend in generating potential customers. If one channel or campaign yields a lower CPL than another (and the leads are of comparable quality), it’s the more efficient approach. Marketers use CPL to allocate budgets to the best-performing tactics, forecast how many leads they can generate with a given budget, and ensure they’re not overspending to reach their lead targets. It’s also a key input for understanding Customer Acquisition Cost (CAC) – if you know your lead-to-customer conversion rate, you can estimate CAC (more on that in the next article). However, keep in mind that a “lead” is not a guarantee of a sale. So low CPL is good, but only if those leads eventually convert at a reasonable rate. A super-low CPL campaign that generates tons of unqualified leads may actually be less valuable than a higher CPL campaign that yields fewer but very high-quality leads. We’ll touch on quality later, but CPL is a starting point to gauge cost efficiency in the lead generation stage. Why Cost Per Lead Is a Crucial Metric Budget efficiency: Companies often have monthly or quarterly lead generation goals (e.g., X leads per month) within a fixed budget. Knowing your CPL helps determine if you can hit those goals. For instance, if your budget is $10,000 and your historical CPL is $50, you can expect ~200 leads. If that’s not enough, you either need to increase budget or improve CPL. Marketers constantly strive to lower CPL so they can get more leads for the same spend. Channel and campaign performance: CPL allows an apples-to-apples comparison of different marketing efforts. You might be generating leads via Google Ads, Facebook Ads, trade shows, content syndication, etc. CPL lets you compare effectiveness: e.g., “Our Facebook campaign CPL is $20 while our trade show CPL (including booth costs) is $200 – digital is far more efficient in generating leads.” Such insights guide where to double down or what to cut. If a particular campaign has an unusually high CPL, it flags an issue – maybe the targeting or messaging is off or the channel is inherently expensive for your industry. Indicator of marketing-sales alignment: In some organizations, marketing passes leads to sales. A high CPL might raise eyebrows from management or sales if they feel marketing is spending too much for each opportunity. Keeping CPL in a reasonable range demonstrates marketing’s efficiency. Moreover, tracking CPL over time can validate improvements: if you implement a marketing automation tool or new optimization and CPL drops, you have concrete evidence of increased efficiency. (Pro tip: share CPL improvements with sales teams too – it shows you’re being accountable and improving, building trust between teams.) Profitability and ROI: Ultimately, the lower your CPL relative to the value of a lead (or a resulting customer), the higher your marketing ROI. Say you know that on average 1 in 10 leads becomes a customer, and a customer is worth $1,000 profit. That means one lead is worth about $100 in profit (on average). If your CPL is $50, that’s a good ratio – spend $50, ultimately get $100 in value (minus other costs). If your CPL were $150, you’d be upside down unless you improve conversion or customer value. Many businesses have target CPLs derived from such calculations. For example, they might decide “we need to keep CPL under $100 to maintain our desired ROI.” If they find a channel’s CPL is $200, they either optimize it down or shift budget elsewhere. Scalability: When planning to scale your lead generation (ramping up spend to get more leads), CPL can help forecast results and spot diminishing returns. Often, as you scale spend in a channel, CPL might rise because you’ve saturated the easiest wins and start reaching less responsive audiences. Monitoring CPL will show you that point. If CPL starts creeping up as you increase budget, it might be time to explore new channels or refine targeting. In summary, CPL is a vital sign of how cost-effectively you’re acquiring the lifeblood of your business – potential customers. It’s closely watched by marketing managers and executives alike, as it links dollars spent to tangible outcomes. A strong grasp of your CPL and its drivers allows for smarter strategy and resource allocation. Industry Benchmarks and Channel Averages for CPL How much should a lead cost? The truth is, it varies widely by industry, lead definition, and channel. Let’s look at some data to get a sense of the range: Overall Averages: According to a 2024 industry compilation, the average cost per lead across all industries and channels was around $198 (this stat often comes from aggregating many types of businesses, so treat as a rough ballpark. But this number is not very actionable since it’s so generalized. It’s more useful to break it down. By Industry: A report from FirstPageSage in 2025 showed CPL benchmarks for 30+ industries, split by organic vs. paid channels. A few examples: In legal services, leads are pricey – average CPL for attorneys was reported at $144 on Google search ad and similarly over $100 via Facebook lead. Highly competitive industry and high client value drive up bid costs, hence higher CPL. In technology or SaaS, average customer acquisition costs are high, which implies leads also can be expensive – e.g., software industry CPLs can be in the hundreds of dollars (given CAC might be $1000+). One SaaS benchmark put average CAC at $70, which for a 10% lead-to-customer conversion implies CPL around $70 (this is just a rough inference). Real estate: A wide range depending on the lead type. For real estate agents, online leads might cost $20-$30 each via portals or ads. However, FirstPageSage’s data indicated real estate companies (like property investment leads) see very high CAC (over $2,800, thus leads could cost a few hundred each in some cases. Retail e-commerce: Typically has a lower CPL; often one might look at cost per acquisition directly for e-comm, but for lead generation (newsletter sign-ups, etc.) it’s relatively cheap. One source indicated the retail industry had an average paid CPL around $41 (organic even lower. E-commerce tends to have many touchpoints and is volume-driven, so even small CPL savings scale up. Financial services: These leads (like insurance quotes, credit card sign-ups) often cost more. For instance, insurance industry average CPL might be around $100-$150. The Focus Digital report listed Fintech CPLs around $77 (organic) to $95 (paid), and insurance around $122 (organic) to $183 (paid). Those numbers align with high value per lead. B2B services: Many B2B industries (consulting, software, manufacturing) report CPLs from $50 up to a few hundred, depending on the niche and how far the lead is from a sale. For example, in B2B tech, a whitepaper download might cost $60 via LinkedIn ads, whereas a direct demo request via Google Ads might be $150+. A HubSpot study (2023) highlighted that what constitutes a “good” CPL depends on industries and channels, but seeing CPL under $100 in expensive B2B sectors is often considered decen. As you can see, the range is huge – from sub-$20 leads in some consumer sectors up to $200+ leads in competitive B2B fields. The combined average of 10 industries was around $606 CPL according to one analysis (which likely included very high-cost industries, but that isn’t representative of most typical businesses. By Channel: The channel you use has a big impact on CPL: Paid search (Google/Bing Ads): Tends to have a higher CPL than some other channels, because clicks are often costly. A WordStream 2024 report pegged the *average cost per lead in Google Search ads at $66.69 across industries. This varied: legal was highest at $144, while industries like Restaurants were around $3. Search ads capture intent, but you pay for that intent. Paid social (Facebook/Instagram): Often can produce lower CPLs, especially for B2C or broad audiences. For example, the average cost per lead in Facebook Lead Ads is about $21.98 across all industries – notably lower than Google’s average. Facebook’s native lead forms have reduced friction, helping drive CPL down. However, B2B leads on LinkedIn might be quite expensive (LinkedIn clicks are costly), sometimes $50-$100+ CPL common, but if it’s a quality enterprise lead, it might be worth it. Organic search (SEO content): While not “free” (you invest in content creation, SEO), organic leads often have no direct cost per click. If you have a robust content marketing operation, your effective CPL could be very low. A FirstPageSage analysis found organic channels like SEO and email have the lowest CAC for many B2B companie, which implies low CPL. For instance, email marketing was cited as a low-CAC channel for B2B– which makes sense: once you have a list, sending emails is cheap, and any leads (responses, sign-ups) generated have minimal incremental cost. Email and referral: If you consider referrals or word-of-mouth leads – those might have near-zero cost (aside from maybe running a referral program). Email campaigns to your house list similarly have very low marginal cost; you might just count the overhead of maintaining the list and creating content. So if you can generate leads from referrals or your existing customer base, the CPL is extremely low. One study from VisitorQueue showed email marketing leads cost ~$53 on average (still low relative to most paid, and channels like referrals or speaking engagements can be even lower. Trade shows & events: These can be pricey. For instance, factoring in booth cost, travel, sponsorship, etc., your CPL could easily be a few hundred dollars or more at a big expo. However, the leads might be high quality. Many companies still find value here despite high CPL. You’d calculate total spend on the event divided by number of leads scanned or collected. Content syndication & affiliates: Paying third-party networks or affiliates for leads often comes at a fixed rate – sometimes $20-$50 per lead depending on niche. That essentially sets a CPL. If they guarantee lead quality criteria, this can be a scalable way to pay for leads. The CPL is often competitive with your own ads (the networks optimize their channels to deliver at that rate). The key is ensuring those leads convert down-funnel; otherwise you might cut such programs even if CPL is moderate.   Remember, a “good” CPL is one that’s profitable in your business model and compares well to alternatives. If you’re selling a $50,000 software package, a $200 CPL might be fantastic. If you’re selling a $100 consumer product, a $200 CPL is obviously too high. Always relate CPL to downstream metrics like CPA (cost per acquisition) and LTV (customer lifetime value). Strategies for Reducing CPL Lowering cost per lead means either reducing your spend, increasing the number of leads, or both (while maintaining lead quality). Here are actionable strategies to achieve that – many revolve around improving the efficiency of your marketing so that more people convert into leads per dollar spent: 1. Improve conversion rates on your landing pages: Often, a major factor in CPL is the percentage of visitors who convert into leads. If you can raise your landing page’s conversion rate, you get more leads for the same traffic, effectively lowering CPL. Focus on Conversion Rate Optimization (CRO): Simplify forms (maybe you don’t need 10 fields; try 3-5 essential ones). A study by HubSpot found that reducing form fields from four to three can increase form conversions by almost 50%. Sharpen your landing page copy and headline to match what the ad promised. Ensure a clear value proposition and a prominent call-to-action (CTA). If someone clicked an ad about a “free consultation”, the landing page should immediately reference that offer with a big “Request Your Free Consultation” button. Use social proof or trust signals (testimonials, client logos, security badges) to reassure visitors. People are more likely to fill a form if they trust your site. For example, adding customer testimonials on a landing page can increase conversions by 34% (according to VWO data). A/B test different page elements: headline wording, imagery, layout, form design. For example, one company might find that adding a relevant image or video on the page boosts conversions, while another finds removing distractions (navigation links) helps. Let data guide you. Make sure your landing pages load fast and are mobile-friendly – slow or non-mobile-optimized pages bleed conversions (and thus raise CPL). Google data shows even a 1-second delay in mobile load can significantly hurt conversion rates. By doing these, you might turn a 5% converting page into a 10% converting page – cutting CPL nearly in half for campaigns driving traffic there. 2. Refine targeting to improve lead quality and intent: Another way to reduce CPL is to attract more qualified prospects who are likely to convert into leads easily. Search ads: Continuously optimize your keyword list. Add negative keywords to weed out irrelevant clicks (saving budget for real prospects). For example, if you offer enterprise software, exclude “free” or “DIY” keywords that attract non-buyers. Focus spend on specific, high-intent terms (like “enterprise CRM demo”) even if volume is lower – these often convert to leads at a much higher rate, lowering CPL. One strategy is using SKAGs (single keyword ad groups) for your top keywords, so you can craft ultra-relevant ads and landing pages that maximize conversion rate, thus lowering CPL. Social ads: Utilize the detailed targeting. On Facebook, use lookalike audiences based on your customer list – these often yield better CPL because you’re targeting people similar to those who already converted. On LinkedIn, target specific job titles or industries relevant to your product instead of broad categories; yes, LinkedIn CPLs are higher, but if the conversion to opportunity is higher, your effective CPL of a qualified lead might be better. Also, use lead scoring feedback: if certain audience segments consistently produce leads that sales rejects, adjust your targeting or messaging to filter them out earlier. Account-based marketing (ABM): If you’re B2B with defined target accounts, focusing on those accounts in your campaigns can ensure you’re paying for leads that really matter. While ABM ads might have higher cost per click, the leads are precisely the ones you want, so there’s less waste. This often improves the cost per marketing-qualified lead (MQL), which is what really counts. Some companies report that an ABM approach reduced their CPL by concentrating spend on a list of high-potential companies rather than broad geotargeting. Retargeting (remarketing): People who have visited your site or engaged with your content before are more likely to convert to leads when retargeted, often at a lower CPL than cold audiences. Set up retargeting campaigns to bring back warm prospects with a lead magnet offer (e.g., “You checked out our site – download our free guide to learn more”). These often have great CPLs because the audience is already interested. For instance, HubSpot’s marketing team found that some long-term *creator partnerships (a form of retargeting via influencer channels) cut their CPL by 30-40% compared to cold ads on Meta and Google. Time and geo targeting: If certain times of day or regions convert better, allocate more budget to those. For example, if your B2B campaigns see higher form fill rates during business hours and drop off at night, you might limit spend to 8am-6pm to improve overall CPL. Or if leads from certain countries are low quality or unlikely to buy, consider excluding them from campaigns to concentrate budget where it yields real leads. 3. Leverage high-ROI inbound channels (content, SEO, referrals): As noted earlier, organic inbound leads usually have a lower effective CPL. While it takes investment to build, the payoff in cost efficiency can be huge: Content marketing & SEO: Create valuable content (blogs, whitepapers, videos) that attracts your target audience via search or social sharing. For example, a well-optimized blog post that ranks on Google can generate a steady stream of free leads through a call-to-action in the post. Companies that blog see 55% more traffic (and consequently more leads) *than those that don’t, largely because each piece of content can bring in new visitors. Ensure each piece of content has a relevant lead magnet or call-to-action (newsletter sign-up, content download, etc.) to capture those visitors as leads. Over time, your cost to acquire those leads is just the content creation cost. If a blog post that cost $500 to produce generates 100 leads over its lifetime, that’s a $5 CPL – extremely low. Similarly, update and republish old high-traffic posts to keep them ranking and collecting leads without fresh spend. Email marketing & marketing automation: If you already have a database of contacts, nurture them with email campaigns rather than solely relying on fresh paid leads. Emails to your list cost very little. If you can re-engage dormant contacts or upsell interested ones, your CPL for those “internal” leads is negligible. Use marketing automation to trigger emails based on behavior (e.g., if someone views your pricing page but doesn’t sign up, send a follow-up email offering help or a case study). You already paid to get that lead initially; investing a bit in nurturing can convert more of them, effectively lowering the average CPL because more leads become marketing-qualified or sales-ready without new ad spend. A famous stat: lead nurturing can produce a 20% increase in sales opportunities compared to non-nurtured leads (Forrester) – which means more ROI from your existing leads. Referrals and partner marketing: Encourage referrals through incentive programs or simply by providing an excellent product that people talk about. Customer referrals often come at no cost. Also, partner with complementary businesses to share leads or co-market (e.g., a webinar together). That way you tap into their audience without heavy spend. For example, if you co-host a webinar with a partner and each of you promotes to your list, you might generate hundreds of leads each to share, at the mere cost of time and coordination. If you consider the value of those leads, the CPL is effectively very low. HubSpot’s research notes that *organic channels with the lowest CAC include email marketing and public speaking for B2B, and social media and webinars for B2C – meaning efforts like webinars or events (even virtual) can yield high-quality leads at low cost due to their value and shareability. Implementing strong inbound marketing can gradually bring your average CPL down. For example, one company might find that after a year of consistent blogging and SEO, 30% of their leads are coming in “organically” with virtually no incremental cost, thereby significantly lowering blended CPL compared to when 100% of leads were from paid ads. 4. Use marketing automation and AI to increase lead volume without proportional spend increase: Automation can help you capture and convert leads more efficiently: Chatbots on your site: A chatbot can engage site visitors 24/7 and turn more of them into leads by offering help or content. This can especially capture leads who might not fill out a form on their own. It’s a one-time/capital expense that can yield many additional leads essentially for free (post-setup). For example, if 5 out of 100 visitors typically fill a form, but a chatbot convinces another 5 to leave their info via conversation, you’ve doubled leads without increasing traffic. Companies like Drift claim that conversational chatbots have increased site conversion rates significantly, thereby lowering CPL from those channels. AI tools for lead generation: Some companies use AI to optimize ad targeting or content personalization. For instance, there are AI tools that can manage PPC bids better than humans in real-time, finding pockets of cheaper clicks that still convert. HubSpot noted using AI in marketing automation increased inbound leads by **99%*. If you can nearly double your lead count with the same or slightly increased spend through AI-driven optimization, you’ve effectively slashed your CPL since you’re getting more leads per dollar. Similarly, AI on your website can personalize content (like showing industry-specific case studies to certain visitors), potentially increasing conversion rates and hence lead volume from existing traffic. Lead scoring and filtering: While not directly lowering CPL, lead scoring can indirectly improve efficiency. By scoring leads and identifying the best ones for sales, you can focus sales efforts (which are a cost) on leads likely to convert. Some marketing teams even set up automated filtering – e.g., if a lead doesn’t meet certain criteria, they don’t hand it to sales (sparing the cost of sales follow-up on a low-quality lead). Instead, they might nurture it further. This means the leads you count (and spend sales time on) are more likely to convert, effectively improving the ROI of each lead you generate. It can also prevent what looks like a low CPL from being deceptive due to lots of junk leads – by filtering, your reported CPL might rise a bit (since you’ll consider only qualified leads as the output), but your cost per qualified lead goes down, which is what matters for acquisition. In essence, smarter use of technology can yield more leads from your existing funnel at marginal cost, thus reducing CPL. 5. Optimize your ad spend and bidding strategy: If you are using paid channels, scrutinize how you’re spending: Reallocate budget to best CPL campaigns and pause underperformers. It sounds basic, but run regular reports. You might find, for example, your search campaign for Product A has a CPL of $40, while Product B’s campaign CPL is $90. If Product B’s lead value isn’t double that of A’s, you might shift some budget from B to A to get more total leads for the same money. Try different bidding strategies. If you currently bid manually or for clicks, test using Google’s Target CPA (cost per acquisition) bidding or Facebook’s leads objective with optimization for lead submits. These algorithms use machine learning to get you more conversions for your goal CPL. If you set a reasonable target CPL, sometimes these can gradually bring costs down. (Be cautious though: setting an unrealistically low target CPL in automated bidding might choke off volume.) Quality Score and Ad Relevance: On Google, improving your Quality Score (via better ad relevance and higher expected CTR) effectively lowers the cost per click you pay, which in turn lowers CPL. Writing compelling ads not only improves CTR but also can reduce CPC by a significant margin. Ensure your ads and keywords tightly align with your landing page content for a high Quality Score. Use cheaper channels where possible: For instance, if LinkedIn Ads CPL is too high, see if you can reach a similar audience on Facebook at a lower CPL (maybe by targeting interests or lookalikes related to those job titles). Or if search ads are expensive, try content syndication or smaller ad networks that might have less competition. Sometimes diversifying channels can find lower-cost pockets of leads. Just make sure to track lead quality from these channels to confirm they’re worthwhile. 6. Partner with creators or influencers: A modern strategy some brands use is working with industry influencers or content creators to drive leads. HubSpot’s marketing team, for example, found that *creator partnerships became a top growth driver, cutting CPL by 30-40% compared to standard Meta and Google ads. The idea is that a trusted personality can promote your downloadable resource or webinar to their engaged audience, yielding many leads at a fraction of the cost of traditional ads. You might pay the influencer a flat fee or sponsor a piece of content, but if it nets hundreds of leads, the effective CPL can be very low. Plus, these leads come somewhat pre-warmed by the influencer’s trust. Key here is to choose creators whose audience matches your target profile. If done well, influencer marketing can tap into an already-curated audience at low cost per engagement. 7. Focus on lead quality (and define your lead criteria): This is less about lowering the dollar CPL and more about ensuring effective CPL. If you tighten your lead qualification criteria (for example, count a “lead” only when it meets certain firmographic data or engagement level), you might generate fewer leads but of higher quality – sales can convert them at a higher rate. This means you’re spending the same, but more of the leads turn into customers, effectively lowering the cost per acquisition. Some practical steps: Add a qualifier field in forms (like company size dropdown, or budget range). If someone is outside your target, perhaps route them to a lighter nurture track rather than sales. This prevents bogging down sales with low-quality leads and lets marketing perhaps nurture them until they become better. It might slightly raise CPL (because a few more people may bail at the longer form), but the leads you get will be more sales-ready – a worthwhile trade-off. Score and threshold leads: use behavior (pages visited, interactions) to only count leads that show intent. If you only pass along high-intent leads, sales can close more, effectively lowering cost per actual customer. It also means you’re not throwing money at acquiring types of leads that never convert. For example, if leads who download your free tool but never attend a demo have a low conversion rate, maybe you stop promoting that free tool as a “lead magnet” and instead promote a consultation, resulting in fewer but more qualified leads. Your CPL might go up, but your Cost per Customer will likely go down, which is the real goal. While this might seem like it’s not directly lowering CPL, it ensures dollars are spent on leads that have a chance. It’s better to pay $100 each for 50 leads of which 10 become customers, than $50 each for 100 leads of which 5 become customers. In the second scenario you spent the same $5,000 but got half the customers – the CPL was lower, but CAC was higher. So focusing on quality leads to better overall economics even if surface CPL rises. As the saying goes, don’t optimize for CPL at the expense of quality – keep an eye on the full funnel. 8. Monitor and iterate relentlessly: Continuously track your CPL by campaign, by channel, by offer. Create a dashboard. When you launch a new initiative, set a CPL goal and measure results. If something is off, dive in quickly to troubleshoot (is the targeting off? landing page conversion low? message not resonating?). The faster you iterate, the less budget is wasted on high CPL efforts. Agile marketing – testing small, measuring, and scaling successes – keeps your average CPL in check. In practice, a combination of these strategies tends to work best. For example, a company might realize their Google Ads CPL is high, so they improve the landing page (CRO) and add negative keywords (targeting refinement) – CPL drops 20%. Then they invest more in content marketing; as organic leads start flowing in, their blended CPL across all channels drops further. They also leverage an email re-engagement campaign that revives old contacts into new leads at virtually no cost. All these moves together can drastically reduce the overall CPL over time. One notable modern tactic from above: using marketing automation and AI. It’s worth highlighting a recent trend: marketers incorporating AI reported significant improvements in lead generation efficiency. For instance, adopting AI-driven tools at HubSpot led to a *99% increase in inbound leads, effectively halving CPL if spend remained constant. It underscores that embracing new tech can give a leap in results, not just incremental gains. To cap off this section, remember that lowering CPL shouldn’t come at the expense of pipeline quality. It’s about smart efficiency, not just penny-pinching. If a certain channel has a higher CPL but yields much higher-value leads, it may still be worthwhile. The end goal is a low CPL with good conversion downstream, meaning you’re getting the most revenue impact for the least cost. Monitoring CPL and Ensuring Lead Quality After implementing tactics to reduce CPL, it’s critical to monitor the results and also track what happens after the lead acquisition: Set up proper tracking: Use UTM parameters on URLs and conversion tracking in platforms (Google Ads, Facebook, etc.) to attribute leads to the right source and campaign. In your CRM or marketing automation, record the source of each lead. This allows you to calculate CPL for each source accurately. Marketing dashboards that show CPL by channel and campaign will highlight where you’re winning or losing. Evaluate conversion to opportunity/customer: A low CPL is great, but if none of those leads convert to sales, it’s a hollow victory. Always look at the percentage of leads from each source that become customers (or whatever your end goal is). You might find that a channel with CPL $100 yields customers at $500 each, whereas a channel with CPL $20 yields customers at $2000 each (because few low-cost leads actually convert). In that case, the $100 CPL channel is actually more cost-effective in the long run. This is why many teams move beyond CPL to metrics like Cost Per Marketing Qualified Lead (MQL) or Cost Per Acquisition (CPA), which we will discuss in the next section. But as a marketer, you often have most control in the lead stage, so optimizing CPL with an eye on quality is key. Feedback loop with sales: Work with your sales team (or whoever handles leads after marketing) to gauge lead quality from different sources. If sales says “the leads from source X are all unqualified/time-wasters,” you may need to refine that source or drop it, even if CPL was low. Conversely, if they love the leads from a webinar you ran (because they were well-educated and ready to talk solutions), that’s a sign that even if that webinar’s CPL was a bit higher, it’s worth it. Open communication ensures you’re optimizing for what really counts: revenue. Adjust lead definitions if needed: As mentioned, you might tighten what you count as a lead. Early in marketing maturity, you might count every form fill. Later, you might only count a lead once it meets criteria (like has business email, is in target industry, etc.). This can raise your reported CPL but result in better downstream metrics. It’s okay because you’re then focusing on the leads that matter. Always be clear on definitions when comparing CPL benchmarks or showing improvements (ensure you’re comparing apples to apples). Case Example – Continuous Improvement: Let’s consider a SaaS company as an example. Initially, they were getting leads via Google Ads at $80 CPL. They applied several strategies: improved their landing pages (boosting conversion), added negative keywords to cut waste, and started a content campaign that began producing organic leads. Within six months, their blended CPL fell to $50. More importantly, because they monitored quality, they noticed the Google Ads leads converted better than others, so they didn’t cut that spend drastically even though it was a bit higher CPL than the new organic leads. Instead, they used savings from trimming waste to increase spend on the high-converting campaigns, maintaining a balanced CPL while growing overall lead volume. As a result, their quarterly lead count doubled without increasing budget, and sales saw a fuller pipeline of good leads. This kind of iterative improvement cycle – measure, tweak, re-measure – is the hallmark of effective CPL management. Conclusion Cost Per Lead is a fundamental metric that connects your marketing dollars to tangible results. By focusing on lowering CPL, you are essentially getting more leads for every dollar spent, which fuels your growth engine more efficiently. We covered how CPL can vary by industry and channel – from ~$20 in some social campaigns up to $100+ in competitive B2B fields – and that understanding these benchmarks helps set expectations and goals. Crucially, we explored multiple strategies to reduce CPL: Optimizing conversion rates on landing pages and forms (more leads from the same traffic), Sharpening targeting and improving ad relevance (better use of budget), Investing in organic inbound channels like SEO, content, and referrals to generate leads with little incremental cost, Leveraging tools like marketing automation and AI to scale lead capture effectively, And constantly measuring and reallocating spend to what works best. Implementing these strategies can yield dramatic improvements. Recall that some companies have nearly doubled their lead output by adopting AI or refining campaigns, or cut CPL by a huge margin via partnerships – inspiration that big gains are possible beyond small tweaks. However, always balance quantity with quality. The ultimate goal isn’t just cheap leads; it’s cost-effective customer acquisition. CPL is one piece of that puzzle. A low CPL is a win only if those leads convert at a healthy rate down the line. So as you optimize CPL, keep an eye on lead-to-deal conversion and adjust accordingly. It’s better to pay a bit more for a lead that’s likely to become a customer than to chase ultra-cheap leads that never will. In a time of tight marketing budgets and the mandate to “do more with less,” mastering CPL gives you a powerful handle on efficiency. It allows you to demonstrate to stakeholders: for X dollars, we can reliably generate Y leads. And by continuously refining, you can make Y bigger over time, or X smaller, or both – which is music to any business’s ears. So, start implementing the ideas discussed: Audit your current CPLs and identify high-hanging fruit areas. Run tests on your landing pages and targeting. Cultivate those inbound channels (maybe start that blog or YouTube series you’ve been considering). Explore new optimization tools or partnerships. Even small improvements, compounded across campaigns, can significantly reduce your average CPL and boost your lead volumes. And that ultimately means more opportunities for your sales team and more growth for your company, all within the same budget. By treating CPL not as a static number but as a metric you actively manage and improve, you put your marketing on the path of constant optimization. Lowering the cost to acquire leads frees up resources that can be reinvested or saved, making your marketing engine leaner and stronger.
    an illustrative infographic for Cost Per Acquisition (CPA): Optimizing the Cost of Gaining New Customers.

    May 5, 2025

    Marketing Team

    Introduction: After generating leads (often measured by CPL, as we discussed in the previous article), the next crucial step is turning those leads into customers. Cost Per Acquisition (CPA), also known as Cost Per Customer Acquisition or Customer Acquisition Cost (CAC), measures the cost to acquire a paying customer. It’s a metric that goes a step further down the funnel – instead of cost per lead, it’s cost per converted lead. CPA is vital because it directly impacts profitability: if it costs you $500 to acquire a customer who brings $400 in revenue, that’s a problem. In this article, we’ll clarify what CPA encompasses, why it’s so important for aligning marketing with business outcomes, examine benchmarks and factors that influence CPA across industries, and outline strategies to lower your CPA without stunting growth. By mastering CPA, you ensure that your marketing and sales engine is not just producing leads, but doing so in a profitable, scalable way. What is Cost Per Acquisition (CPA)? Cost Per Acquisition (CPA) is the average cost to acquire one customer. In formula form: CPA = Total Sales & Marketing Spend / Number of New Customers Acquired This calculation can be applied in aggregate (overall marketing spend divided by total new customers in a period) or for specific channels or campaigns (e.g., ad spend on Google Ads divided by number of customers gained from those ads). For example, if in a month you spent $10,000 on marketing and sales efforts and gained 50 new customers, your average CPA that month is $200. If a particular Facebook Ads campaign cost $1,000 and yielded 10 customers, that campaign’s CPA is $100. A “customer” in this context typically means a first-time paying customer (somebody who makes a purchase or signs a contract). Sometimes marketers also look at Cost per Conversion if the “conversion” is a sale – in many cases, CPA and cost per conversion are used interchangeably, but we’re focusing on actual customer acquisition. It’s also worth noting that some businesses might calculate separate CPAs for different definitions of acquisition (e.g., cost per trial sign-up vs. cost per paying subscriber). For our purposes, we mean fully acquired customers. Why CPA matters deeply: Profitability and LTV: It’s directly tied to unit economics. If your CPA is higher than the profit you make from a customer (often measured via Customer Lifetime Value, LTV), then you’re losing money acquiring customers – an unsustainable situation. Companies strive to keep CPA well below LTV. A common benchmark is aiming for an LTV:CAC ratio of 3:1 or higher (meaning the customer brings in 3× the cost to acquire them). If your ratio is 1:1 or worse, you’re spending a dollar to get a dollar – or losing money. For example, if it costs $100 to acquire a customer and that customer on average yields $300 gross profit over their lifetime, that’s a healthy 3:1. If it costs $100 to acquire and they only bring $50, you have an issue. Measures full-funnel effectiveness: While CPL tells you marketing efficiency up to lead generation, CPA tells you the effectiveness of the entire journey (marketing + sales) at turning that lead into a customer. A high CPA might mean marketing is spending too much per lead (high CPL) or sales isn’t closing efficiently, or perhaps lead quality is low – it prompts a deeper look at your funnel. It encapsulates both volume and conversion quality. Many execs consider CAC/CPA one of the most important metrics because it shows how much growth is costing. Budgeting and forecasting: Knowing your CPA helps in forecasting how many customers you can acquire with a given budget and how fast you can scale. If you have a $50k budget and an average CPA of $250, you can estimate ~200 new customers. If that’s not enough to hit targets, you either need to increase budget or improve CPA (likely both). Compare channels and campaigns: Just as CPL can compare efficiency, CPA can compare effectiveness by channel. You might find Google Ads has a CPA of $100, while Facebook has $150. Even if Facebook brings in more leads, Google is giving cheaper customers. That insight would lead you to allocate more to Google until it scales up to parity. Or perhaps your email marketing (to existing leads) has a CPA of just $20 because many convert from nurtured leads, which tells you to invest heavily in nurturing programs. It essentially helps identify where your marketing dollars yield the most paying customers. Long sales cycles considerations: In businesses with longer sales cycles (common in B2B), CPA accounts for all the cumulative marketing and sales costs over that cycle to close a customer. It encourages a view of marketing and sales as one continuum rather than silos. Both teams impact CPA: marketing by generating quality leads cheaply, and sales by efficiently converting them. By watching CPA, companies encourage alignment – if CPA is too high, is it marketing’s spend or sales’ process that needs optimization (often both evaluate together)? Investor/Board metrics: If you seek funding or report to a board, CAC is a metric they care about. It speaks to scalability: if acquiring customers is getting more expensive over time, that’s a red flag about market saturation or inefficiency. Many startups will spend heavily upfront (leading to high CPA) with the plan to bring it down later via brand recognition or scale. But eventually, they need to show a path to an acceptable CPA relative to LTV. So tracking it early and often is key to ensuring you’re on the right trajectory. It’s important to clarify that measuring CPA can be a bit more complex than measuring CPL: You need to attribute revenue or customer conversions back to marketing efforts. In a simple e-commerce scenario, that might be straightforward (cost of marketing / number of sales in that period from that marketing). In a multi-touch B2B, you might have to decide attribution rules (first touch, last touch, multi-touch). Often, companies include sales expenses in CAC (like sales salaries, commissions, tools) plus marketing spend. Essentially, CAC encompasses all costs to acquire customers. Some distinguish between “CPA (marketing only)” and “CAC (marketing+sales)”. Make sure you know what’s included in your figure. For fairness, when comparing to LTV, include only costs that scale with acquiring customers – definitely include program spend and possibly fully loaded sales/marketing salaries if you want a true picture of profitability. CAC can vary widely by customer segment or channel, so sometimes an overall average isn’t as actionable. Many firms will compute CAC by segment (e.g., CAC for small business customers vs enterprise can be very different, perhaps $500 vs $5000). That helps assign correct budgets to each go-to-market approach. Now, let’s look at some numbers to benchmark: Industry Averages: As mentioned, it varies a lot. A 2024 Userpilot article noted the *average CAC for SaaS was $702 (though ranges widely). Another source indicated an average B2B customer acquisition cost of ~$400 (but again, depends on product price). E-commerce tends to have lower CPA. One report by Littledata suggested an average CAC of $45 for D2C e-commerce, but it can be much higher in competitive niches. Shopify’s 2024 guide gave some industry CACs: e.g., Arts & Entertainment $21, Health & Beauty $127, *Electronics $377 (those might be organic CAC given context, but it shows range). Focus Digital’s report shows real estate paid CAC at $2,830 vs organic $1,830, and software paid CAC $2,174 vs organic $1,520. On the lower side, *retail paid CAC $226, organic $41– retail is lower because of higher volume and lower margin per customer. Venturz’s 2025 list of CAC by industry shows things like Manufacturing ~$723, Real Estate ~$791, Education ~$806, etc. which are high but again likely reflecting B2B or high-value context. A frequently cited stat: the average CAC for an e-commerce customer is around $64 (from Invesp), but it can vary by source (email being lowest, paid search higher). Broadly, B2B CACs can be hundreds or thousands (since deal sizes are large), whereas B2C CACs can be in the tens of dollars if it’s a fast-moving consumer product, or hundreds if it’s something like fintech or high consideration. Channel Differences: It often costs more to acquire a customer via paid channels than via organic/referral channels (as we saw with CPL and CPC). For example, Focus Digital’s data for ROI showed *SEO’s ROI was 748% vs Google Ads 36% – implying SEO’s cost per customer is far lower relative to value. Their CAC by channel: *Email CAC $1,028, LinkedIn $1,489, Organic social $1,643, Meta Ads $2,117, Google Ads $1,953 (these numbers might be specific to some scenario, but directionally show paid is higher). Paid search often yields higher-intent customers, so conversion rate to sale is high, balancing some of the higher CPL. WordStream’s benchmarks show average conversion rates on search ~4, and average CPA (cost per action) on search ~$5 for an action (which could be a lead or sale). Paid social can have lower CPL but also lower conversion to sale, which can make CPA on social sometimes higher than search. However, if social is used for retargeting warm audiences, CPAs can be excellent. WordStream’s Facebook benchmarks 2024 indicated the average *cost per lead on Facebook was $21.98, but cost per actual acquisition depends on product and follow-up. Referral and word-of-mouth typically have the lowest CPA – essentially just the cost of any referral program incentives. Many companies find that their cheapest customers are those referred by others (and often they’re higher LTV too, bonus!). That’s why we often see referral programs (Uber’s free ride credits, etc.). Email and CRM marketing to existing leads have very low CPA for upsells or reactivations – it’s basically just marketing time. But for new customers, email isn’t an acquisition channel (except to re-target leads). Marketplaces or affiliate channels might charge a commission on sale (e.g., you only pay when a sale happens). If that commission is, say, 10%, then effectively CPA is 10% of your selling price. Depending on margin, that could be favorable or not. But it’s a way to ensure you don’t pay until an acquisition is confirmed. Trends: Over the past few years, many digital CPAs have risen due to competition and increased privacy (which made targeting less efficient). For example, one report noted that Facebook’s CPMs increased ~47% from 2020 to 2021, which would trickle down to higher CPA unless conversion rates improved. iOS 14 privacy changes in 2021 made Facebook targeting less precise, which many advertisers reported increased their CPA (some saw 20-30% jumps) as the algorithm had a harder time finding converters, and tracking gaps made optimization lag. On Google, anecdotally, CPCs have been rising in many industries due to increased competition online, leading to higher CPA if budgets remain constant. However, improved tools (like Google’s smart bidding) have helped some advertisers reduce CPA by ~20% per Google’s statements, by using machine learning to bid more effectively. Also, the proliferation of martech and growth hacking might initially lower CPA for innovators, but as everyone adopts similar strategies, the advantage shrinks. For example, early adopters of LinkedIn ads might have had cheap CPAs when few were using it; now it’s pricey. Conversely, new platforms like TikTok might currently offer lower CPAs for certain consumer products due to lower ad costs. Another trend: companies focusing on lifetime value and subscription models may tolerate higher initial CPA (even above first sale revenue) if the recurring revenue pays it back. So the definition of “too high CPA” depends on payback period tolerance. E.g., some SaaS might accept a CAC that is 12 months of revenue, banking on profit in years 2-3. Sales model impact: Self-serve models (like low-cost SaaS where customers sign up on the website) often have lower CPA because no sales salary is involved. These companies’ CAC might mostly be marketing spend. High-touch models (enterprise software with salespeople) have higher CPA because you add salary, travel, lengthy POCs, etc. It’s not uncommon for enterprise CAC to be in the thousands or tens of thousands. But if LTV is hundreds of thousands, it works out. A key metric is CAC payback: how long does it take to recoup CAC from a customer’s revenue. Many SaaS aim for <12 months payback. If your CPA is $500 and your customers pay $100/month, that’s 5 months payback (good). If payback is >18 months, many investors consider that too long unless retention is extremely high. To give concrete examples: A small e-commerce store might say: we spent $5,000 on Facebook ads and got 250 orders, so CPA = $20. If their average order profit is $40, that’s okay. A fintech app might report: our blended CPA is $150 (including marketing and referral bonuses) to get a new active user. If that user’s net revenue over a year is $300, that’s acceptable. An enterprise B2B company might have a CAC of $15,000 using a field sales model, but each customer is worth $100k+ in lifetime profit, so the ratio is fine. The key is to know your numbers and watch trends. If your CPA was $50 last year and is $80 this year with no increase in LTV, that’s a sign to dig in and optimize. Strategies to Lower CPA (Cost per Acquisition) Lowering CPA is about improving efficiency at every stage of the customer acquisition process – from marketing to sales conversion – and ensuring you’re targeting the right customers. Many strategies overlap with those for lowering CPL, but we’ll extend them through the conversion to customer. Here are key approaches: 1. Improve Lead-to-Customer Conversion Rates (Sales Efficiency): One of the most powerful ways to reduce CPA is to convert a higher percentage of your leads into paying customers. This way, you get more customers out of the same marketing spend. Lead nurturing: Implement strong nurture campaigns for leads who aren’t ready to buy immediately. Use email workflows, remarketing ads, webinars, etc., to educate and build trust. For example, if someone downloads a whitepaper but isn’t responding to sales, enroll them in an email sequence that shares case studies, how-to videos, or industry insights. When they’re more educated and sales follows up later, they’ll be more likely to convert. Companies that excel at lead nurturing generate 50% more sales-ready leads at 33% lower cost (Forrester) – meaning nurturing not only yields more customers, it effectively lowers CPA by making use of leads you already paid for. HubSpot found that using marketing automation to nurture leads resulted in a *99% increase in inbound leads (which ultimately translated to more customers). Sales and marketing alignment: Ensure sales follows up with leads promptly and appropriately. Research shows that contacting a lead within an hour of inquiry can dramatically improve conversion rates. If marketing is generating leads at $20 each but sales takes a week to respond, many leads go cold – raising CPA because you lose conversions. Set up processes so that, for instance, high-intent leads (like demo requests) alert sales immediately and get contact within minutes. Also, provide sales with context (lead source, pages viewed) so their outreach can be tailored – making conversion more likely. Quick and tailored follow-up increases close rates, which lowers CPA. Lead qualification: Focus sales energy on the best leads. Use lead scoring to identify which leads are hot and which need more nurturing. If sales reps spend time on low-quality leads, you’re effectively inflating CAC (paying sales salaries on deals that won’t close). By filtering out poor-fit leads (or nurturing them longer until they show more intent), your sales team can concentrate on high-probability opportunities, closing a higher percentage. For example, if you improve your lead-to-customer conversion from 10% to 15% by focusing on better leads, a given pool of leads yields 50% more customers – thus CPA drops by a third. Many companies achieve this by aligning on an Ideal Customer Profile (ICP) – marketing targets those who fit it to lower wasted leads, and sales prioritizes those who match. Optimize the sales process: Identify and fix bottlenecks in the sales cycle. If you notice many leads stall after a demo, perhaps the demo isn’t addressing their needs or follow-up is weak. Provide training or playbooks for reps to handle common objections better. If contracts are a bottleneck, simplify pricing or terms. The faster and smoother the sales process, the lower the drop-off, and the lower the CPA. For instance, reducing the sales cycle time can keep prospects warm and increase win rates. Consider offering limited-time incentives to encourage quicker close (e.g., a small discount if they sign by end of quarter) – if it boosts conversion rates, the slight revenue trade-off can be worth the improved CPA. Just be careful not to erode too much margin; evaluate if the incentive cost is lower than the CAC savings from higher win rate. Retargeting non-converted leads: If a lead goes cold, don’t give up – retarget them with ads or re-engagement campaigns. It’s cheaper to re-engage an existing lead than to acquire a new one. For example, run LinkedIn ads specifically to leads in your CRM who haven’t bought yet, showcasing customer testimonials or new features. These ads keep you top-of-mind and can bring some leads back into active consideration, effectively giving sales another shot without paying for a whole new lead. Every extra existing lead that closes is one less new lead you needed to acquire, reducing overall CPA. Case in point: A software company found that by implementing a structured follow-up cadence (sales call within 1 day, personalized email at day 3, a webinar invite at day 7 for those who didn’t respond, etc.), their lead-to-customer conversion rose from 5% to 8%. This improvement meant their CPA dropped from $1,000 to around $625, since they were closing more customers for the same marketing spend. Such process improvements cost little but pay off in CAC. 2. Lower Cost Per Lead (Up-Funnel Efficiency) – while maintaining quality: Many tactics to reduce CPL, as discussed in the earlier article, also feed into lower CPA. But we’ll reiterate a few with emphasis on how they affect final acquisition cost: Focus on high-converting channels: Identify which lead sources produce customers at the lowest cost, not just leads. For example, maybe trade show leads have a high CPL of $200, but they close at 20% (so CPA $1,000), whereas Facebook leads have CPL $50 but close at 5% (CPA $1,000 also), and organic leads have CPL $30 and close at 10% (CPA $300). In that scenario, organic is the star – invest more in SEO/content since it yields $300 CPA, and consider if trade show or Facebook budgets can be shifted. The idea is to allocate budget to sources where CPA is lowest, which might not always be the lowest CPL source if conversion rates differ. An actual example: HubSpot noted that SEO leads have a 14.6% close rate, while outbound leads (like direct mail or print ads) close at 1.7% – so even if SEO leads cost a bit more to generate, they have far better CPA because they convert so much more frequently. Target high-value customer segments: If certain segments of leads (from certain campaigns or criteria) tend to become higher-value customers or convert more, focus on acquiring those. That lowers effective CPA relative to value. For instance, if you find enterprise leads cost 2× more than SMB leads to acquire, but enterprise deals are 10× the revenue, the CAC relative to revenue is much better. So you might accept a higher CPL or CPA in absolute terms for enterprise leads because CAC/LTV is better. In practical terms, that could mean shifting ad targeting or content to attract more enterprise prospects. Conversely, if a segment has notoriously low conversion or low LTV, you might decide to stop pursuing them even if the CPL was cheap – because the cost per paying customer is actually high when you factor in their low likelihood to buy or low revenue. This increases overall ROI of marketing spend and ensures you spend where you can recoup it. In essence, prune the low-ROI leads from your funnel; this will show up as slightly higher CPL (since you cut some “cheap” but low-value lead sources) but your CPA and LTV/CAC will improve. Geographical or platform optimization: Similar to above, certain regions or ad platforms might yield better final results. If your Google Ads produce cheaper customers than your LinkedIn Ads (even if LinkedIn brings in fancy job titles), then re-balance to Google. Or if certain geographies have lower CPA (maybe less competition in ads or more receptive market), focus marketing there. For example, some SaaS companies found their CAC in some European countries was half that of the US (due to different competitive landscape) – so they scaled marketing in Europe faster relative to US to maximize overall growth within ROI targets. Holistic retargeting and multi-channel marketing: Using multiple touches to nurture leads can improve overall conversion rate and thus lower CPA. For example, one might argue retargeting ads (which cost extra) increase marketing cost, but if they significantly raise the conversion rate of leads, the net effect can be lower CPA. You might spend $5 extra per lead on retargeting them with ads featuring customer success stories, but if that leads to a 20% relative increase in lead conversion, the $5 is well spent. It’s like paying a bit more per lead to get more customers out of them – if $5 gets even one more sale out of 20 leads, that could drop CPA dramatically. Always measure to ensure the added spend does indeed reduce CPA. Double down on referrals/word-of-mouth: These are typically your lowest CPA acquisitions because your customers do the “marketing” for free or for a small incentive. Make it easy for happy customers to refer others (referral links, in-app prompts, etc.). If you have a referral program with rewards, consider that reward in your CPA calculation. Usually, it’s much lower than what you’d pay to acquire via ads. Dropbox famously grew huge by offering free storage for referrals – the “cost” in storage was negligible compared to the value of the new users acquired essentially for free. If referrals account for a bigger portion of your new customers, your overall blended CPA will drop. So, invest in customer satisfaction and referral loops – it’s an indirect marketing spend that pays off by lowering average acquisition cost. 3. Optimize Pricing and Offers to Improve Conversion (and value): Tactics around pricing and promotions can influence how many leads convert to buyers and how much they spend – both factors in effective CPA: Entry-point offers: Consider offering a smaller or easier-to-purchase option to hook new customers. If high price is a barrier causing low conversion (hence high CPA), an entry-level product or a free trial can get more people in the door. For example, a software company might introduce a lower-tier plan or monthly pricing (instead of annual only) to reduce friction. This can increase conversion rates of leads to paying customers (even if at a lower price initially), thus lowering CPA because more leads convert. You then have those customers to upsell later. Essentially, it’s better to acquire them at a slightly lower initial value than not at all – as long as you have a strategy to grow that value over time (so that LTV justifies it). Do the math to ensure this makes sense (if a lower price doubles conversion rate, what does it do to LTV and payback?). Promotions and discounts: Judicious use of discounts or limited-time offers can push fence-sitters to buy now. If you have leads aging in your pipeline, try sending a special offer (e.g., 10% off or a bonus feature if they sign by end of month). This can improve your close rate, effectively turning more leads into customers (thus reducing CPA). Of course, the cost is reduced revenue per customer, so you must ensure the math checks out – the increase in conversion should offset the margin cut. Many companies find that promotional spend is a worthwhile part of CAC. For instance, if offering a $100 discount increases your conversion from 10% to 15%, and your average revenue is $1000, that’s $100 less revenue on 5 more sales out of 100 leads = $500 less revenue but 5 more customers. If previously 10 customers gave $10k, now 15 customers give $14.5k (15*$1000 – 5*$100), you gained net $4.5k for that campaign. You spent $500 in discounts, but gained $5k in extra revenue, so ROI positive. And CPA in terms of marketing dollars spent might be unchanged, but effective CPA including promo as cost would have dropped from $100 (assuming $1000 spend / 10 customers) to ~$103 (marketing $1000 + $500 promos / 15 customers = $100 each marketing + ~$33 promo = $133 “all-in CAC”). Actually in this example, all-in CAC rose slightly due to promo cost, but LTV also up. Need an example where it clearly lowers. Let’s say without promo, 10 out of 100 buys, with $100 marketing per lead = $1000 CAC each. With promo, 15 out of 100 buys, plus $100 each promo cost = marketing cost per customer ~$667 + $100 promo = $767 CAC each, which is lower. Actually, check: 100 leads, marketing cost $10,000 ($100 each), base case 10 customers -> CAC $1000. With promo, same $10k marketing, plus $1500 in total discounts, 15 customers -> ($10k+$1.5k)/15 = $766. So yeah, CAC dropped ~23%. The sacrifice is each customer gave $900 revenue not $1000, but if margins allow, volume gained was worth it. The key is you acquired more customers cheaper, albeit with slightly less revenue each. Increase customer value (LTV): This doesn’t lower CPA directly, but it makes a higher CPA acceptable. If you can upsell/cross-sell new customers quickly or increase prices (if market allows), your effective cost per acquisition relative to value improves. For example, if you raise your subscription price by 20%, your revenue per customer goes up – if CPA remains the same, the LTV/CAC ratio improves and payback shortens. Some companies adopt a strategy of initially spending a lot to get a customer (high CPA), then making money on expansions or renewals. If you have room to raise prices or encourage add-ons, you might tolerate the current CPA but make it “lower” in percentage terms. However, do pursue lowering actual CPA too; relying solely on price increases could backfire if competitors undercut you. Churn reduction: Keeping customers longer means you don’t need to acquire as many new ones to hit revenue goals – effectively, it lets you amortize acquisition cost over a longer revenue stream. If you lower churn, the ROI of each acquired customer increases, making your CAC more palatable. While this doesn’t change CPA in accounting terms, in strategy terms it means you can accept current CPA because LTV improved. But also, happy customers refer more and might buy more – feeding back into lower future CPA as discussed. So align marketing and customer success efforts; a seamless onboarding and great product experience ensure the customers you paid to acquire actually stick (improving effective CAC per retained customer). Trim unprofitable products or channels: If certain products or campaigns consistently show a high CPA relative to the revenue those customers generate, consider cutting them. E.g., if a campaign yields customers who only buy a one-off $50 item and never return, its CPA might always be higher than the profit from those buyers. It might be better to not pursue those customers at all (saves cost, raising overall profitability). Instead, focus marketing on campaigns that yield repeating or higher-value customers where CAC will be recouped. In essence, fire some customers before you even acquire them – not all customers are equally valuable. 4. Use Data and Analytics (Attribution) to Allocate Spend Wisely: Many companies waste portions of their budget on efforts that don’t actually drive conversions. Multi-touch attribution: Ensure you’re tracking which marketing touches contribute to closed deals, not just to leads. It might be that certain early-funnel campaigns get lots of leads but none of those leads ever become customers. If you only looked at CPL, you’d think it’s working. But by looking at CPA by first-touch, you may find, for example, that a particular content syndication source brings leads at $50 each, but hardly any close (so maybe $1000+ CPA). That might lead you to cut that source, saving money. Conversely, you might find some channels have higher CPL ($200 per lead) but those leads convert at 50%, yielding $400 CPA – which could be great for your model – so you invest more there even if it looked “expensive” per lead. Attribution analysis connecting lead source to deal won or lost is critical to find these insights. Marketing mix modeling: Especially if you have many channels including offline, use statistical models to understand the contribution of each to final sales. This can reveal some channels you didn’t credit in typical attribution are actually important (and worth their cost), or vice versa. For instance, a model might show that your radio ads (which are hard to attribute in Google Analytics) are driving people to search and convert later – so their cost is justified in CPA when viewed holistically. On the other hand, maybe a pricey sponsorship you did had no measurable lift in leads or sales – you might then cut it, lowering overall customer acquisition cost. Close the loop on data: Make sure when customers are acquired, you feed that info back to your ad platforms and CRM. For example, importing offline conversion data (like which leads became customers) back into Google and Facebook helps their algorithms optimize for the kind of leads that turn into customers, not just any lead. Google’s Target CPA or value-based bidding will then focus on sources and users likely to drive actual sales. Over time, this can significantly lower your CPA – one case study saw a 20% drop in CPA after importing actual sales data for optimization, because Google started targeting more qualified prospects (it learned which clicks led to revenue). Test controlled experiments: Where possible, run experiments to validate if a channel is truly driving incremental customers or just cannibalizing. For instance, pause a campaign for a week (or in a few regions) and see if sales drop significantly or if they’re largely replaced by organic. This can reveal some spending is non-incremental (people would have bought anyway). By cutting that, you reduce wasted spend and lower effective CPA because now every dollar spent is actually creating a new customer, not paying for one that would have come organically. Such experiments are challenging but can be very illuminating (e.g., some advertisers found branded search ads had high CPA that was unnecessary because those users would click the organic listing anyway – so they trimmed spend there and overall CAC improved). Identify and fix friction points through data: Analyze your funnel metrics – where do leads drop off? If lots of prospects start a trial but don’t convert to paid, perhaps the trial experience is lacking. Fixing that could raise the trial conversion and drop CPA (since more trial leads become customers). Data from product analytics or funnel analysis might show, say, users who do X action in trial convert at 30% vs 5% who don’t – so you then focus on getting all trials to do X (perhaps through in-app guidance or a customer success call). That improves conversion, reducing CPA. It’s not pure marketing, but marketing often can help (e.g., by setting proper expectations in marketing copy so trial users are qualified and serious, or by nurturing trial users with tips via email). 5. Lower Cost of Sales (for Sales-Driven models): We often include sales costs in CAC. Making sales more efficient effectively lowers CPA. Inside vs outside sales: If you can move from an expensive field sales model (traveling, dining clients, long onsite meetings) to a primarily inside/remote sales model, you can reduce average cost per deal. Many companies found during 2020 that they could close deals via Zoom that previously might have required flights – saving thousands per deal. If those savings stick, they permanently cut CAC. Evaluate your sales activities: perhaps expensive trade shows or events your sales team attends aren’t yielding enough customers to justify their big costs – you might reallocate those dollars to digital efforts that have clearer ROI. Sales automation: Use CRM automation to cut down sales rep time on non-selling tasks (data entry, scheduling). The more deals a single rep can handle, the lower the personnel cost per acquisition. Also use tools like auto-dialers or sequences to ensure follow-ups happen consistently – avoiding lost leads that you paid to acquire (every lost lead that could have converted is wasted CAC). Even using something like calendar links to schedule meetings easily can reduce friction and drop-off in the sales process. Train and support reps: Well-trained reps who know the product deeply and can handle objections will close at a higher rate (improving conversion) and possibly faster (freeing capacity to handle more leads). Regular sales coaching, sharing of best practices, and strong sales enablement content (case studies, product collateral) can boost their effectiveness. If each rep improves win rate by even a few percentage points, that directly lowers CPA because fewer leads are needed per win. Also align incentives properly – e.g., if marketing passes a lot of leads, but reps cherry-pick a few and ignore others, maybe their comp plan could incentivize working all leads or at least quickly disqualifying them (so marketing can nurture). Self-service where possible: If you can let some percentage of customers buy without talking to sales (via an online checkout or a usage-based free trial that converts to paid), you remove sales cost for those acquisitions. This greatly lowers CPA for that segment. Many companies adopt a hybrid model – small accounts self-serve, big accounts get sales attention. This way, expensive sales effort is only applied where necessary (enterprise deals), and you don’t waste it on tiny deals. If, say, 30% of your customers could self-serve at a CAC of just your marketing cost (no sales), your overall blended CAC falls. Example: Atlassian famously had no formal sales team for a long time; customers bought Jira and Confluence online. Their CAC was mainly marketing (which was low through word-of-mouth), hence extremely efficient growth. Now, not every business can do that, but think if parts of yours can. 6. Test New Acquisition Channels (and Scale the Efficient Ones): Sometimes the key to a lower CPA is to find a channel where your audience is accessible more cheaply. If traditional channels are saturating (driving up CPA), try emerging platforms. For example, some brands found early success on TikTok ads or influencer collaborations at lower CPAs because competition was lower and content could go viral. If you manage to establish a presence in a channel before others flood it, you might enjoy a window of low CAC. Keep experimenting with small budgets on new things – maybe podcasts, sponsor a niche newsletter, partner on a webinar series – and measure results. You might discover a pocket of high-intent leads coming from a source your competitors aren’t using yet, giving you great CPA. Affiliate marketing: Launch or expand an affiliate program where you pay a commission for referred customers. This way, you only pay when an actual customer comes in (which means by definition CAC is under control). For example, if you give affiliates 20% of the first purchase, and they bring you customers, your effective CPA is 20% of your average order. Often that’s quite efficient, and you’ve shifted the risk of advertising to the affiliate. Companies like Amazon built huge affiliate networks that drive sales at a set, controlled CAC (their commission rates). Ensure you manage affiliate quality so those customers are good (some affiliates might bring low-quality traffic otherwise). But in many cases, affiliate customers have reasonable retention and cost-of-sale is only that commission, no upfront marketing expense from you. Referrals and word-of-mouth focus: We already covered referrals in CPL, but to reiterate for CPA – doubling down on making your product so good and easy to share can drastically lower CAC. Think about how Dropbox or Slack grew – primarily through users inviting other users (free to the company). Invest in product features that encourage sharing or have inherent virality (like being more useful when others join – e.g., collaborative software). If each customer brings another organically, your effective CAC halves. Geographic or demographic expansion carefully: If one market is tapped out and yielding high CPA, consider if another market might be lower hanging fruit. For instance, maybe advertising costs in certain international markets are lower and there is demand for your product. As long as those customers monetize enough, expanding there could yield a better CAC/LTV ratio. Just account for localization costs. I’ve seen SaaS companies that find overseas CAC at 50% of domestic due to less competition, allowing them to grow more efficiently globally. Negotiate better rates: If you use third-party lead providers or events, negotiate bulk deals or performance-based pricing. For example, if an event normally costs $20k to sponsor and yields 100 leads (CPL $200), see if you can do pay-per-lead with them or co-marketing that lowers your cost. This is more of a tactical idea – sometimes smaller industry publishers are willing to charge per lead (like $50 per lead for access to their audience via an email blast). If you can strike such deals where you only pay for results (and results are guaranteed), you can manage CAC tightly. Just ensure lead quality (maybe pay more for leads that meet criteria). 7. Improve Marketing Measurement and Stop What’s Not Working: A theme through all this is measuring to know what to cut vs expand. If you haven’t already, set up a robust system (CRM with campaign tracking, Google Analytics with conversion imports, etc.) to track a lead from source to sale. This will highlight, for example, that your fancy $10k/month thought leadership ad campaign on LinkedIn generates lots of clicks and even form fills, but zero customers, whereas a scrappy $2k/month Google Ads campaign on long-tail keywords quietly drives 5 deals a month. With that clarity, you’d obviously reallocate money to Google, lowering overall CAC. And it’s not a one-time analysis – schedule monthly or quarterly ROI reviews. It’s common for a channel’s performance to shift over time. Maybe a competitor ramped up their marketing and now your Google Ads CAC is creeping up – you might shift budget to Microsoft Ads where it’s cheaper, for instance. Or if a trade show that worked last year flopped this year (maybe due to lower attendance), note that and consider skipping next year. Attribution vs reality: Use a combination of attribution models and overall marketing spend to sales correlation. Don’t rely only on last-click data, or you might mis-value channels. For instance, branded search ads often get credited for conversions (since people search your name to sign up), but the actual cause was earlier marketing (Facebook ad, blog post, etc.). If you cut all top-of-funnel and see brand search conversions fall later, that means those TOFU channels were needed even if they didn’t get last-click credit. So a holistic approach is needed: aim to lower CAC but not by cutting fuel to the fire. One method is to watch organic direct traffic and overall conversion volume when testing cutting a channel – if they drop, that channel had some effect beyond what attribution showed. To illustrate, consider a SaaS company with a $1000 CPA on average looking to improve: They analyze and find their Google Ads produce customers at $800 CPA, but their LinkedIn Ads are at $1600 CPA. So they reduce LinkedIn spend and increase Google – weighted average CPA might drop to $900. They notice leads from webinars convert at 20% versus 5% for ebook downloads, so they shift content strategy to do more webinars relative to ebooks – even if webinar CPL was higher, the CPA is lower due to conversion. This maybe brings CPA to $800. They shorten their sales cycle by implementing a free trial that lets users self-serve some of the process, increasing conversion rate of lead to sale. Combined with nurturing improvements, their overall lead-to-customer goes from 10% to 15%. Now, fewer leads are needed per customer – marketing can either acquire less (saving cost) or keep same spend and just get more customers. Their marketing spend was say $500k for 500 leads ($1000 each) and 50 customers ($10k CAC), now 75 customers ($6667 CAC). With other steps it might be now $800 * (50/75) ~ $533 effective? Actually if cost fixed but more customers, CAC down proportionally – from $10k to $6.67k in that example. Summing improvements, they perhaps cut their average CPA from $1000 to, say, $600 over a year or two. This dramatically improves their margins or allows them to reinvest more into growth at the same ROI. Key point: Lowering CPA often doesn’t come from one silver bullet, but many optimizations across marketing targeting, sales process, and cross-team strategy. One must also consider diminishing returns. You can lower CPA to an extent, but not infinitely. At some point, you’ve picked all the low-hanging fruit (the easiest customers). If you want to grow further, you might have to accept gradually higher CPA as you go after more challenging customers. The goal is to keep it within acceptable bounds (below LTV threshold). A smart strategy is to segment CAC goals – e.g., maybe you have a target CAC for SMB segment vs enterprise segment, and you allocate budget to maximize growth while keeping each within target. Monitoring CPA and Long-Term Sustainability As you implement improvements, keep tracking CPA and related metrics: Regular reporting: Have a dashboard that shows cost, new customers, and CPA by channel/month. This lets you spot trends – e.g., if CPA creeps up for three months in a row, you can investigate why (maybe bid costs rose, or conversion rates dipped due to a website issue, etc.) and course-correct quickly. Segmented CPA: Track CPA for different marketing channels, customer types, etc. You might find one segment’s CAC is rising due to increased competition, so you shift focus to another. Or maybe your overall CAC is flat but a crucial segment (like enterprise) has rising CAC – you’d dive into that specifically. CAC payback and LTV:CAC: As discussed, monitor how quickly a customer pays back their acquisition cost via gross profit. If your payback period is increasing (taking longer to break even on CAC), that’s a warning sign – either costs are rising or customers are spending less/shorter. That could influence strategy (maybe time to innovate product or pricing to raise LTV, or double down on retention to boost LTV, in parallel with CAC work). Continuous testing: The market and platforms evolve, so something that lowered CAC last year might not this year. Keep testing new ideas. For example, maybe your lookalike audiences on Facebook got saturated; try a different seed audience or try a new ad format (like Facebook lead ads vs landing page). Or if you exhausted one content topic that performed well, experiment with adjacent topics to bring in a fresh audience. Strategic vs tactical view: Ensure the pursuit of lower CPA doesn’t conflict with longer-term brand building. Some activities (like broad brand awareness campaigns) may have a high immediate CPA (if measured on short-term conversions) but are necessary for pipeline building and future sales. Approach those with intention: perhaps account for some percentage of budget that won’t show immediate ROI but is expected to improve overall conversion rates long term (which eventually lowers CPA in indirect ways, like higher brand awareness leading to higher CTR and conversion). Communicate this with management – maybe track an alternate KPI like branded search volume or direct traffic as a proxy to show those efforts are working. Avoid cutting muscle: Don’t cut marketing/sales costs blindly to reduce CAC, or you might starve growth. There’s often an optimal CAC for maximum growth within profitable bounds, not the absolute lowest CAC. For instance, you could drastically cut CAC by only marketing to your tiny base of super-likely customers (CAC goes down, but volume is also low, you under-utilize potential). Usually, there’s a trade-off between scale and efficiency. Define what a sustainable CAC is and try to achieve that while still capturing a large market share. If your CAC is well below your target threshold, you might even choose to spend more to grow faster until CAC approaches that threshold (intentionally acquiring some higher cost customers because you can afford to). In other words, minimize CAC for a given growth level, or maximize growth for a given CAC target. To conclude this section: lowering CPA is about working smarter across your marketing and sales process – targeting better, converting better, and constantly re-evaluating what brings in the best customers for the least cost. When you get it right, you have a repeatable customer acquisition machine that you can scale knowing each new customer is adding value to the company, not draining it. By bringing your CPA down, you widen your profit margins and/or free up budget to invest in even more growth. It’s a core element of sustainable marketing. In the final section, we’ll examine the ultimate metric that ties it all together: Return on Investment (ROI), which is boosted significantly by improvements in CPA and the other metrics we’ve discussed.
    Think your rankings are real? They might not be. Learn how to spot the signs of artificially inflated SEO and what to do about it.

    April 16, 2025

    Marketing Team

    If you’re looking to drive more organic traffic and rank higher on Google, mastering SEO is non-negotiable. With constant algorithm updates and evolving user behavior, your old tricks may no longer work in 2025. The good news? There are still tried-and-true strategies—updated for the times—that can move the needle fast. Here are 5 proven ways to improve SEO rankings and boost your website traffic. Whether you’re a business owner, content marketer, or SEO specialist, these actionable tips will help you compete (and win) in the search results. 1. Optimize for Search Intent, Not Just Keywords Ranking for a keyword doesn’t matter if you’re not solving the searcher’s problem. In 2025, search intent is the backbone of SEO. Every piece of content you publish should match what users are actually looking for when they type in a query. Informational intent: Write blog posts, how-tos, and guides. Navigational intent: Make sure your homepage or service page ranks for your brand or product name. Transactional intent: Create landing pages optimized for conversions. Tip: Use tools like Semrush or Google Search Console to review keyword performance and align your content with top-performing intent. 2. Boost On-Page SEO with Clear Structure and UX Google cares not just about keywords, but how easily users can digest your content. That’s why on-page SEO and user experience (UX) go hand in hand. Here’s how to strengthen both: Use H2 and H3 subheadings to structure content logically. Keep paragraphs short (2–3 lines) for better readability. Embed internal links to relevant blog posts or service pages. Ensure fast page load times (under 3 seconds is ideal). Design for mobile-first indexing, which Google prioritizes. When your site is easy to read, navigate, and understand, Google will reward it with better rankings—and users will stick around longer. 3. Focus on High-Quality, Evergreen Content Content still reigns supreme—but not just any content. You need helpful, original, and evergreen content that solves real problems for your audience. This is the kind of content that earns backlinks, keeps traffic coming long after publishing, and helps build topical authority in your niche. To create winning SEO content: Answer questions your audience actually asks (check Google’s “People also ask” section). Use tools like AnswerThePublic, Ahrefs, or Ubersuggest for content inspiration. Update older posts with fresh data and internal links. Use schema markup to make content eligible for rich results like FAQs and featured snippets. Google is smarter than ever—rewarding quality and penalizing fluff. Make every word count. 4. Build Authoritative Backlinks the Right Way Backlinks are still one of the top ranking factors. But in 2025, quality far outweighs quantity. One high-authority backlink from a trusted site can do more for your rankings than dozens of spammy links. Here’s how to earn backlinks that matter: Guest post on reputable industry sites with a real audience. Create original research, infographics, or tools worth referencing. Use HARO (Help A Reporter Out) to get quoted in articles and link back to your site. Reach out to sites linking to outdated content and suggest yours as a better resource (a tactic known as the Skyscraper Technique). And most importantly—build relationships, not just links. The more you connect with others in your niche, the more likely they’ll link to your content organically. 5. Leverage Technical SEO and Core Web Vitals You can have amazing content and great links—but if your site has technical issues, you’re capped on how high you can rank. Technical SEO ensures that your website is fully optimized for crawling, indexing, and ranking. In 2025, Google’s Core Web Vitals are more important than ever. Focus on these elements: Largest Contentful Paint (LCP): Measures load speed of the main content. First Input Delay (FID): Measures how fast users can interact with the page. Cumulative Layout Shift (CLS): Measures visual stability while loading. Other technical best practices: Fix broken links and 404 errors. Submit an XML sitemap to Google Search Console. Use SSL certificates for HTTPS security. Optimize images with WebP format and lazy loading. Use tools like Google PageSpeed Insights, Screaming Frog, or Ahrefs Site Audit to identify and fix problems fast. Final Thoughts Improving SEO rankings and increasing traffic in 2025 isn’t about hacks or shortcuts—it’s about strategy, consistency, and keeping up with the latest best practices. Here’s a quick recap: – Optimize your content for search intent– Strengthen on-page SEO and UX– Create valuable evergreen content– Earn high-quality backlinks– Master technical SEO and Core Web Vitals By focusing on these five pillars, you’ll not only boost your rankings but also build long-term authority and credibility in your space.