AI Visibility Scorecards and Reporting: How To Measure AI Search Presence
Someone on your exec team is going to ask you a question that sounds harmless.
And you’re going to feel the instinct to answer with vibes.
“We’ve been publishing more…”
“Our traffic is up…”
“I saw us once in a ChatGPT answer…”
That’s not an answer.
That’s a bedtime story.
Because AI visibility isn’t a single ranking. It’s a moving set of prompts, platforms, citations, and descriptions, and it changes quietly. No alert, No red banner, No warning light. (If AI gets your positioning wrong, it can just… sit there, being wrong.)
So this post is about one thing:

Visibility without measurement is guesswork.
And guesswork doesn’t survive budget season.
This post shows the AOK approach to baselining AI visibility, monitoring prompts, and reporting progress so marketing leaders can defend spend and steer decisions, with the same kind of discipline you already expect from pipeline reporting.
Also: if you want the template we use, you can grab it here.
AOK_AI_Visibility_Scorecard_Template
What “AI visibility” actually means (and why analytics won’t save you)?
Traditional reporting answers questions like:
- How many sessions did we get?
- What did people convert on?
- What’s our CAC?
AI visibility asks different questions:
- Does the model mention us?
- Does it cite us?
- How does it describe us?
- Are competitors being recommended instead?
- Is AI summarizing us accurately , or confidently wrong?
And here’s the plot twist:
Even when AI does send traffic, platform reporting doesn’t fully tell the story.
Google, for example, explains that AI experiences (AI Overviews and AI Mode) are built into Search, may use a “query fan‑out” approach, and can surface a wider set of links than classic search results. Translation: one user question can trigger multiple sub-searches and a blended set of sources.
So if you try to measure AI visibility like it’s just “rankings,” you’ll miss what matters.
You need a scorecard.
Not because scorecards are sexy.
Because scorecards tell the truth.
See Also:
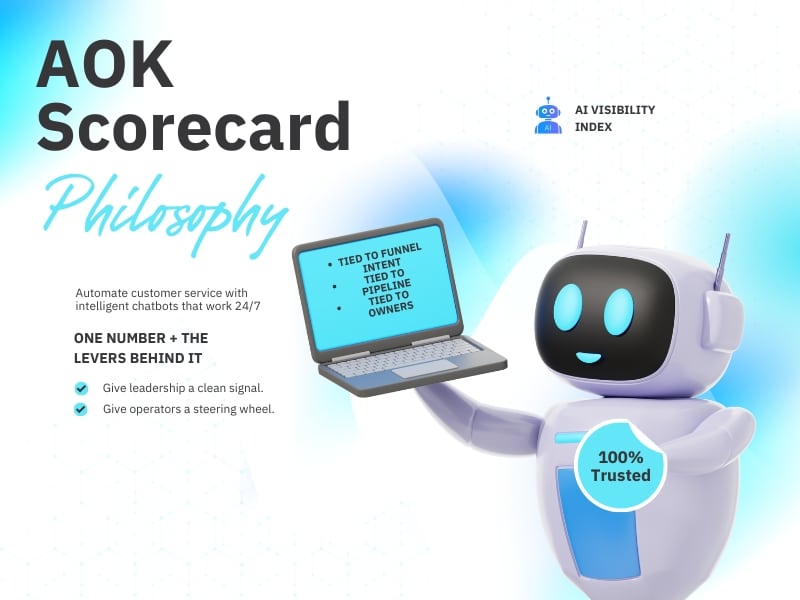
The AOK Scorecard Philosophy: one number + the levers behind it
A scorecard has two jobs:
- Give leadership a clean signal.
“AI Visibility Index: 62 → 71.” - Give operators a steering wheel.
“Mention rate is up because citations increased on these 12 prompts… and our comparison page started getting referenced.”
PR and marketing teams are already doing a version of this: running the same questions across multiple LLMs, scoring visibility, ranking/position, tone, and accuracy, and rolling it up into a single index that can be tracked month over month.
AOK takes that same idea and makes it marketer‑useful:
- tied to funnel intent
- tied to pipeline
- tied to owners
- tied to a cadence
Which brings us to the first step.
Step 1: Baseline AI Visibility (30–60 days)
You can’t improve what you haven’t measured.
And you can’t measure what you haven’t defined.
So the baseline audit is a structured 30–60 day window where we answer:
- Where do we show up today?
- Where don’t we show up?
- What does AI say about us when we do show up?
- Which prompts matter most to revenue?
- Which sources are shaping AI’s answers?
Why 30–60 days?
Because AI visibility is noisy:
- prompts vary
- models vary
- outputs drift
- sources refresh unevenly
A short snapshot can lie.
A baseline period gives you a real signal (and stops your team from chasing ghosts).
What a baseline audit includes
Here’s the baseline checklist:
1) Platform coverage (what are we testing?)
- AI assistants and AI search experiences your buyers actually use (ChatGPT, Google/Gemini experiences, Perplexity, etc.)
2) Prompt universe (what are we testing?)
- prompts mapped to funnel stages (Cold → Warm → Hot → Care)
- prompts aligned to your product lines, ICPs, and use cases
- prompt templates that allow comparison across time (so you’re not changing the question every week)
3) Competitor set (who are we benchmarking against?)
- direct competitors
- “category defaults” (the brands AI always recommends)
- adjacent alternatives buyers consider
4) Output capture (what data do we store?)
- full answer text (for positioning / tone)
- brand mention presence (Y/N)
- rank/position (if list-style output)
- citations: your domain cited? third‑party sources cited?
- notes on inaccuracies
5) Scoring + baseline index
- per prompt
- rolled up by stage, category, and platform
- rolled up into an executive-friendly index
6) Action mapping
- on-page fixes (content / structured data / clarity)
- off-page fixes (mentions, PR, directories, knowledge sources)
- “prompt gaps” (the questions where AI doesn’t mention you)
AOK’s broader AI visibility framework is built around: on-page visibility, off-page authority, and monitoring. This pillar post is the monitoring + governance side of that system.
See Also : Earned Authority for AI: PR, Co-Citations & GEO Strategy (2026)
Step 2: Scorecard Methodology (and a template you can actually use)
Let’s make this practical.
A scorecard that never gets used is just a spreadsheet museum piece.
So your scorecard needs:
- simple fields
- stable definitions
- owners
- a cadence
- and a place for decisions, not just numbers
That’s why the scorecard template includes:
- Visibility KPIs (mentions, citations, top-3 presence)
- Positioning KPIs (accuracy and tone scoring)
- Traffic + pipeline KPIs (AI-sourced sessions and influence)
- Governance KPIs (prompt coverage and issue SLAs)
AOK_AI_Visibility_Scorecard_Template
The minimum viable scoring model
If you want the simplest version:
Per prompt, score these 4 things (0–2 points each):
- Visibility: Are we mentioned?
- Position: Are we near the top of the list?
- Citations: Are we cited / linked (preferably our domain)?
- Quality: Is the description accurate and favorable?
Total per prompt: 0–8
Normalize to 0–100 for exec reporting.
Then you roll up:
- by funnel stage
- by platform
- by product line
- and overall
A tiny example (what it looks like)
| Prompt Category | Prompt | Mention? | Top-3? | Our Site Cited? | Accuracy Issue? | Score |
| Warm (Comparison) | “Brand A vs Brand B for X” | Yes | No | No | Yes | 3/8 |
| Hot (Pricing) | “Brand A pricing” | Yes | Yes | Yes | No | 7/8 |
| Cold (Category) | “Best tools for X” | No | — | No | — | 0/8 |
The table is not the point.
The trend is the point.
Step 3: KPI Framework (Leading + Lagging)
Here’s the trap marketers fall into:
They only report lagging metrics.
Pipeline.
Revenue.
Closed‑won.
Those are outcomes.
They are not steering wheels.
Leading indicators help predict and influence future performance; lagging indicators confirm what already happened. You need both.
So in AI visibility, we track leading KPIs that you can move quickly, and lagging KPIs that prove business impact.
Leading KPIs for AI visibility (what you can change early)
These move first:
- Prompt mention rate (brand appears in answers)
- Citation rate (your domain is cited)
- Top-3 rate (in list prompts)
- Source quality (which sites AI is pulling from)
- Positioning accuracy (human score)
- Tone (human score)
- Prompt coverage (# of monitored prompts vs planned)
Tools like LLMtel.com give you an overall visibility score across AI platforms, which is a useful validation of what “AI visibility metrics” look like in the wild.
Lagging KPIs (proof for budget holders)
These prove the work matters:
- sessions from AI assistants / AI search experiences
- engaged sessions and conversion rate from AI traffic
- leads / MQLs influenced by AI touchpoints
- pipeline influenced
- closed-won influenced
Google notes that sites appearing in AI features are included in Search Console’s overall performance reporting, and also points out that clicks from AI Overviews can be “higher quality” (users spend more time on the site).
That’s a lagging signal.
But it’s only half the story. Because AI can influence decisions without sending clicks.
Which is why the scorecard exists.
Step 4: Reporting Cadence (what to report, to whom, and how often)
A scorecard without a cadence is a dead document.
Here’s a cadence that works in the real world, where people are busy and nobody wants a 47‑slide “visibility update.”
1) Weekly: Operator dashboard (30 minutes)
Audience: Embedded Marketing Owner + SEO/Content + RevOps (optional)
Purpose: steering + action
What you review:
- prompt mention rate trend (top priority prompts)
- new “prompt gaps” (high value prompts where you’re missing)
- accuracy issues discovered (and who owns fixes)
- top cited sources (are they good? bad? outdated?)
What comes out of the meeting:
- 3–5 actions with owners and due dates
2) Monthly: Executive scorecard (15 minutes)
Audience: VP Marketing / CMO / GM
Purpose: decision support
Your monthly exec view should fit on one page:
- AI Visibility Index (overall + by stage)
- 3 wins (what improved)
- 3 risks (what degraded or drifted)
- the next 30‑day plan (what we’re doing about it)
- pipeline signal (if measurable yet)
3) Quarterly: Strategy + budget alignment (45 minutes)
Audience: Marketing leadership + RevOps + (sometimes) Sales leadership
Purpose: resource allocation
This is where you answer:
- Are we winning the prompts that drive deals?
- Which product lines need content + authority investment?
- Are we seeing AI-influenced pipeline growth?
- What’s the next set of prompts we expand into?
Step 5: The Prompt Library (the real asset you’re building)
Most companies treat prompts like random experiments.
Ask a question.
Screenshot a response.
Post it on Slack.
Forget it.
That’s not monitoring.
That’s tourism.
A Prompt Library is a curated set of customer questions you run repeatedly, on purpose, to detect:
- visibility changes
- competitor encroachment
- citation shifts
- positioning drift
- inaccuracies that create brand risk
This is also where AI visibility becomes governable.
How to build a prompt library that doesn’t waste your time?
Organize prompts by intent and funnel stage.
AOK’s Game Theory stages are a simple way to do this (Cold → Warm → Hot → Converted/Care).
Cold prompts (category discovery)
- “What is {problem} and how do companies solve it?”
- “Best {category} tools for {ICP}”
Warm prompts (consideration/comparison)
- “{Brand} vs {Competitor} for {use case}”
- “Alternatives to {competitor}”
Hot prompts (purchase intent)
- “{Brand} pricing”
- “Is {brand} worth it for {use case}”
Care prompts (post-purchase / support)
- “How do I implement {product} for {use case}”
- “Troubleshoot {common issue}”
The AOK_AI_Visibility_Scorecard_Template includes a “Prompt Library” tab with those columns so you can start immediately.
What prompts should you track?
Track prompts that meet at least one of these criteria:
- high intent (pricing, alternatives, comparisons)
- high volume (lots of people ask it)
- high risk (regulatory, safety, compliance, reputational)
- high leverage (it influences multiple product lines or ICPs)
And yes, track the prompts you don’t want to be known for.
Because AI will still answer them.
The governance layer: owners, definitions, and “issue SLAs”
Governance is not a scary word.
It’s just accountability.
NIST’s AI Risk Management Framework describes governance (“GOVERN”) as a cross-cutting function that should be infused throughout the lifecycle of AI systems.
You’re not building the model.
But your brand is being represented by one.
So you still need governance, especially because AI experiences can drift silently.
Our review of the ChatGPT Entity Panel post makes this brutally clear: there may be no notification when “facts drift,” and bad information can harden over time.
So governance for AI visibility means:
1) Definitions that don’t change weekly
- What counts as a “mention”?
- What counts as a “citation”?
- What counts as “AI-sourced traffic”?
- What counts as “influenced pipeline”?
2) Owners for each metric
Not “marketing” as a blob.
Real names.
3) An action log
Because dashboards without decisions are just decoration.
4) SLAs for fixes
Examples:
- Incorrect product description discovered → fix on-site within 7 days
- Key third-party profile inaccurate → outreach/update within 14 days
- Priority prompt gap discovered → content plan within 30 days
Connecting AI visibility to pipeline (without lying to yourself)
This is the RevOps question.
“How do we connect AI visibility to pipeline?”
Here’s the honest answer:
You do it the same way you connect anything to pipeline.
- consistent definitions
- consistent tracking
- consistent attribution rules
Step 1: Create an “AI Assistants” channel in GA4
GA4 allows you to create and edit custom channel groups.
So you build a channel that includes known AI referrers (and you update it over time as the ecosystem evolves).
That gives you:
- AI sessions
- AI conversions
- AI engagement
Step 2: Use traffic-source dimensions correctly
GA4’s traffic-source dimensions are the building blocks for acquisition and attribution analysis.
So you define rules based on:
- source
- medium
- referral hostname
- campaign tagging (when applicable)
Step 3: Tie conversions to CRM stages
If you can’t tie “AI traffic” to:
- leads
- MQLs
- SQLs
- opportunities
…then you can’t claim pipeline impact.
So you align with RevOps on:
- what counts as a sourced lead vs influenced
- how you treat multi-touch journeys
- what timeframe matters
Step 4: Report it as influence until you’ve earned “sourced”
Most AI visibility gains start as influence:
- the buyer sees you in AI answers
- then searches you later
- then comes in direct or branded
So you report:
- AI visibility index (leading)
- AI sessions and conversions (lagging)
- pipeline influence (lagging)
And as tracking improves, you can move closer to sourced attribution.
What reporting should look like (the exec version)?
Your exec report should answer three questions:
1) Are we winning?
- AI Visibility Index trend
- wins/losses vs competitors on high-value prompts
2) Why?
- prompt categories driving gains
- citations shifting toward (or away from) your domain
- positioning improvements (accuracy/tone)
3) What are we doing next?
- next 30-day actions
- owners + timelines
- resource asks (content, PR, dev)
If you want a simple rule:
If you can’t measure it weekly, you won’t improve it monthly.
AI visibility is no different.
FAQ
How do we measure AI visibility?
By tracking a fixed prompt set across priority AI platforms, capturing outputs, scoring presence/citations/positioning, and rolling it into a repeatable index and dashboard. Tools in the market measure mentions and citations with prompt-based testing (LLMtel.com is one example).
What prompts should we track?
Track prompts that map to:
- category discovery (Cold)
- comparisons/alternatives (Warm)
- pricing/proof (Hot)
- implementation/support (Care)
Then prioritize by intent, risk, and revenue leverage. (The prompt library template is included in the download.)
How do we connect AI visibility to pipeline?
Create an “AI Assistants” channel group in GA4, track conversions, align attribution definitions with RevOps, and report influence until you have enough signal to claim sourced.
What should reporting look like?
Weekly operator steering + monthly one-page executive scorecard + quarterly strategy review. Keep it decision-driven and owner-driven.
What does a baseline audit include?
Platform coverage, prompt universe, competitor benchmarking, output capture, scoring/indexing, and an action plan mapped to on-page, off-page, and monitoring levers.
The takeaway
AI visibility is the new “first page.”
But a screenshot isn’t a strategy.
A scorecard is.
If you want to compete in AI answers, you need:
- a baseline
- a prompt library
- a scorecard
- a cadence
- owners
- and pipeline linkage
Not because it’s trendy.
Because that’s how you defend budget and create accountability when the channel is new and the noise is high.
Start with the template: AOK_AI_Visibility_Scorecard_Template